Get the AI Restaurant Quick-Start Guide — Free
The 5 AI tools independent US restaurant owners are using right now to cut labor costs and answer every call.
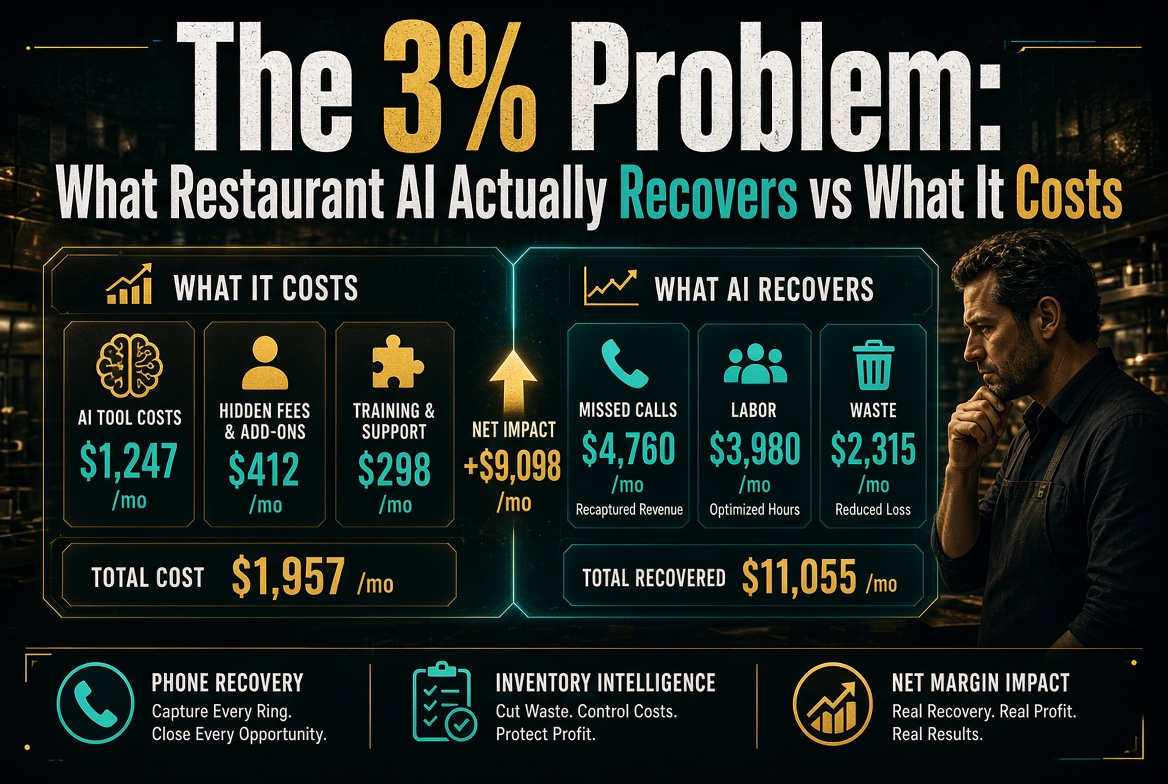
The 3% Problem: What Restaurant AI Actually Recovers vs What It Costs
⚡ Expert Summary: Most restaurant AI vendors sell outcomes, and the outcomes sound enormous — recover missed calls, cut labor hours, reduce waste, lift ticket size. What almost nobody publishes is the arithmetic: how many dollars does a tool actually recover in a month at an independent restaurant’s volume, and what does it cost to get them. This guide does the math across four categories — phone recovery, labor scheduling, inventory and waste, and marketing — using conservative, defensible assumptions. The pattern that emerges is consistent: AI recovers somewhere between two and four percent of the costs it touches, and the winners are the categories with high transaction frequency and clean measurement, not the categories with the loudest marketing.
Walk into any independent restaurant in 2026 and mention AI, and you will get one of two reactions. Either the operator is exhausted by vendors promising transformation, or they have already bought something and cannot tell you whether it worked.
Both reactions come from the same gap. The industry has gotten very good at describing what AI could do. It has gotten remarkably bad at describing what it did — in dollars, at a specific restaurant, over a specific month, net of the subscription.
That gap is what this piece is about. Not whether AI is good. Whether the math clears.
Why Almost Nobody Shows You the Math
Vendor case studies exist, but they suffer from a predictable structural problem. They are selected from the wins, measured over the best period, and reported without the cost line attached. A case study that says “recovered $18,000 in calls” is not lying — it is simply leaving out that the restaurant took 900 calls, that the tool cost $2,400 over the same period, and that the restaurant had a host answering phones during peak hours anyway.
Comparisons across vendors dissolve entirely because each one measures a different thing. One counts a recovered call as a saved reservation. Another counts the same call as a saved customer. A third counts it as an opportunity. The same event becomes three different numbers, and the operator comparing proposals is comparing incompatible units.
The only way through is to build your own arithmetic and hold every vendor to it. That is what follows.
[PENDING INLINE IMAGES]
The Baseline: What a Real Independent Restaurant Looks Like
Numbers only mean something against a volume. So here is a deliberately ordinary independent restaurant — call it a 90-seat full-service concept doing $1.4 million a year, roughly $117,000 a month, split across dine-in, takeout, and a small catering line.
| Line item | Monthly | Share | Why it matters for AI |
|---|---|---|---|
| Revenue | $117,000 | 100% | The ceiling on everything below |
| Food cost | $35,100 | 30% | Waste and yield live here |
| Labor cost | $35,100 | 30% | Scheduling and overstaffing live here |
| Occupancy and other | $21,000 | 18% | Mostly fixed; AI moves little |
| Operating profit | $25,800 | 22% | Before the owner is paid |
Two things follow from this table immediately. First, a tool that saves $300 a month is not trivial against a $25,800 profit line — it is a little over one percent of profit, which is real money for a small intervention. Second, and more important, a tool that costs $300 and saves $300 has done nothing at all, and a vendor counting “recovered opportunity” instead of recovered margin can hide that indefinitely.
Category One: Phone Recovery
Missed calls are the most commonly sold recovery story, and for good reason: the math is easy to build and the loss is easy to demonstrate.
An independent restaurant with a busy takeout line misses calls during peak service. Industry estimates for unanswered calls range widely, but a defensible assumption for a restaurant doing steady takeout volume is that 10 to 15 percent of inbound calls go unanswered during rush periods, with most of those arriving in a two-hour window.
Assume 1,200 inbound calls a month. Twelve percent unanswered is 144 lost calls. Assume 40 percent of those would have converted into an order — a conservative figure, since many callers are asking for hours or directions. That is 58 orders. At a $34 average ticket, the exposure is roughly $1,970 a month.
An AI voice agent answering those calls costs, at typical 2026 pricing for a small restaurant, somewhere between $200 and $400 a month including usage. If it converts even half the recoverable orders, the return is a bit over $985 against a $300 cost — a net of roughly $685 a month, or about 2.7 percent of profit.
That is a good result. It is also a fraction of what the marketing implies, and it collapses entirely if the conversion rate is lower than assumed. A restaurant where most missed callers were asking about parking recovers nothing.
Category Two: Labor Scheduling
Scheduling tools promise to match staffing to demand. The savings are real but capped by something vendors rarely discuss: the floor.
You cannot staff below the level that keeps the service usable. A 90-seat restaurant with a decent dinner service needs a minimum crew regardless of what the forecast says. So the recoverable amount is not total labor cost — it is the excess over the floor, which for most independents is a far smaller number than the 30 percent labor line suggests.
Assume poorly forecast shifts cost the restaurant three overstaffed shifts per week, each carrying about four excess labor hours at $19 fully loaded. That is 12 hours a week, 52 weeks, roughly $11,856 a year — or about $988 a month in exposure. A scheduling tool at $99 to $199 a month that captures even 60 percent of that recovers roughly $590 a month net of cost.
Good, but the capture rate depends on something the tool cannot control: whether the manager actually posts the schedule the tool generates. In practice, adoption is where these savings die.
Category Three: Inventory and Waste
This is where the biggest theoretical numbers live and where the smallest measured results usually appear.
Food cost is $35,100 a month in the model. Waste within that line typically runs 4 to 8 percent for an independent with decent controls. Assume 6 percent — about $2,100 a month in theoretical recovery if waste went to zero, which it never does.
A realistic inventory AI might shave one to two points off the waste rate. At 1.5 points on $35,100, that is roughly $527 a month. Against a tool cost of $150 to $250 a month, net recovery lands near $300 a month.
The discipline problem is severe here. Inventory AI depends on accurate receiving and counting. If staff skip the count, the forecast is worthless, and the software will confidently order the wrong quantity with better typography than the old clipboard did.
Category Four: Marketing and Reputation
Marketing AI is the hardest to measure and the easiest to oversell, because attribution is genuinely difficult and vendors know it.
The honest framing: AI review-response and local-marketing tools do not create demand. They protect it. A restaurant with a strong review profile and consistent responses converts better from the same traffic. Assigning a dollar figure to that is guesswork dressed as analysis.
What can be measured is response time and coverage. A restaurant receiving 60 reviews a month that responds to 20 percent of them is leaving 48 conversations on the table. If faster, more consistent responses shift even a fraction of a point of conversion on existing traffic, on $117,000 of revenue the effect is real — a quarter point of additional conversion is roughly $290.
But the confidence interval on that number is enormous. Treat it as a hypothesis, not a return.
The Full Arithmetic, Side by Side
Here is every category on the same sheet, using the conservative figures above.
| Category | Monthly exposure | Realistic capture | Recovered | Tool cost | Net |
|---|---|---|---|---|---|
| Phone recovery | $1,970 | 50% | $985 | $300 | $685 |
| Labor scheduling | $988 | 60% | $593 | $150 | $443 |
| Inventory and waste | $527 | 100% | $527 | $200 | $327 |
| Marketing and reputation | $290 | Uncertain | $290 | $250 | $40 |
| Total | $3,775 | — | $2,395 | $900 | $1,495 |
Read that total carefully. Four tools, roughly $900 a month in subscriptions, $1,495 in net recovery. As a share of profit that is about 5.8 percent. As a share of the costs those tools touch — the $3,775 of exposure — the capture rate is 39 percent of exposure but only about 1.3 percent of total revenue.
That is the 3% problem in its plainest form. The tools work. The numbers are smaller than the pitch, and the smaller number is still worth having.
What Separates the Categories That Work From the Ones That Don’t
Three variables predict whether an AI tool will produce a measurable return, and none of them is the model quality.
Transaction frequency. Phone recovery wins because it touches hundreds of events a month. Marketing AI loses because it touches a few. High-frequency events produce measurable, compounding gains; low-frequency events produce anecdotes.
Measurement cleanliness. A missed call is a discrete event you can count before and after. “Improved reputation” is not. Tools that produce a clean before-and-after number are the ones you can defend to yourself, your partner, or your lender.
Adoption friction. Every tool that requires staff to do something new has a decay curve. If the count stops, the inventory forecast is garbage. If the manager ignores the generated schedule, the labor savings never arrive. The tool is only as good as the third week of habit.
The Questions That Expose a Bad Deal
Given all this, a small set of questions does most of the work when a vendor presents.
Ask what the tool touches in dollars per month at your volume, not at their average customer. Ask what capture rate they assume and why that rate is defensible for a restaurant your size. Ask what happens to the savings if staff skip one step — because they will. Ask for the churn number among restaurants your size, since a tool that gets cancelled after four months has a product-market problem the demo will never reveal.
And ask the one question no vendor enjoys: what would you tell me to not buy. An honest answer tells you the rep understands the arithmetic. A pitch with no exclusions tells you the arithmetic is not the point.
What to Do With a 3% Return
Take the number seriously without romanticizing it. A net recovery of $1,500 a month on a restaurant with $25,800 in monthly profit is a real improvement — roughly a 5.8 percent profit lift for $900 of subscriptions and some staff habit-building.
What it is not is transformation. It will not fix a concept problem, a location problem, or a labor culture problem. It will not replace the operator’s judgment about the menu, the room, or the pricing.
The useful posture is to think of AI as a set of narrow, measurable repairs rather than a platform. Buy the repair that addresses your most expensive countable leak. Measure it for ninety days against a baseline you wrote down before you started. Keep it if it clears, cut it if it does not, and do not let a dashboard convince you that an opportunity recovered is the same thing as a dollar earned.
Frequently Asked Questions
Is a 3 percent recovery worth the effort?
It depends entirely on your profit line. Three percent of a $25,800 monthly profit is about $775 — meaningful but modest. The same tooling applied to a restaurant with tighter margins produces a larger proportional effect. The effort is only worth it when the category has high transaction frequency so the measurement is clean.
Which category should an independent restaurant try first?
Phone recovery, in most cases. It has the highest transaction count, the cleanest before-and-after measurement, and the lowest staff adoption burden. It is also the easiest to turn off if the numbers do not clear.
Why do vendor case studies show much larger numbers?
Three reasons: they are selected from successful deployments, they often measure recovered opportunity rather than recovered margin, and they usually omit the tool cost over the same period. None of that requires dishonesty, but all of it inflates the ratio.
Do these tools work better in multi-unit groups?
Yes, for a structural reason. Multi-unit groups generate enough transaction volume per category to measure effects precisely, and they can enforce staff adoption centrally. An independent’s savings are real but noisier.
How long before I know whether a tool is working?
Ninety days is a reasonable window for phone recovery and inventory, because both have countable event volumes. Marketing and reputation tools need a longer horizon and will still carry wide confidence intervals, which is a reason to weight them lower in a first round of buying.
What is the biggest mistake operators make with restaurant AI?
Buying several tools at once. When four things change simultaneously and profit moves, there is no way to attribute the change. Sequence the purchases so each one gets its own measurement window against its own baseline.

About Barak Schurr
Barak Schurr built and exited a major ticketing platform, ran global operations at Eventbrite, and now focuses on one question: which AI tools actually help independent restaurant owners run leaner and grow faster. He writes from the operator’s perspective — no vendor spin, no theory, just what’s real in 2026.
Email: [email protected]
More Resources for Restaurant Operators