Get the AI Restaurant Quick-Start Guide — Free
The 5 AI tools independent US restaurant owners are using right now to cut labor costs and answer every call.
Livelytics Release: AI Demand Forecasting for Restaurants
⚡ Expert Summary: Livelytics’ August 2026 product release adds AI demand forecasting and cost-control tools for multi-location restaurants, including hourly labor forecasts, prep anomaly detection, store-to-store benchmarking, and hourly product forecasts. The company points to real outcomes: 5–15% food-waste reduction and 3–8% labor savings. For US restaurant owners, this is the shift-from reports to predictions that decide your P&L before you staff and prep, not after.
The Difference Between a Report and a Prediction
Here is the frustration every multi-location restaurant owner knows too well. You get a report at the end of the week telling you that labor ran over budget on Tuesday and that you wasted too much food on the slow Wednesday nobody saw coming. You already know this. The report is documenting a problem you already lived through, and by the time it arrives, the money is already gone.
That is the fundamental flaw with traditional restaurant analytics: they look backward. They tell you what happened, not what will happen. And in a business where labor decisions are made days in advance and food is ordered and prepped before the demand shows up, a backward-looking report is too late to change anything.
Livelytics’ August 2026 product release is built around fixing exactly that. Instead of another dashboard of what already happened, the release is a suite of forecasting tools designed to predict demand and control costs before you make the staffing and prep decisions. It is aimed squarely at multi-location restaurant businesses that need to forecast demand, control costs, and improve operational performance across multiple sites (Livelytics, August 2026).
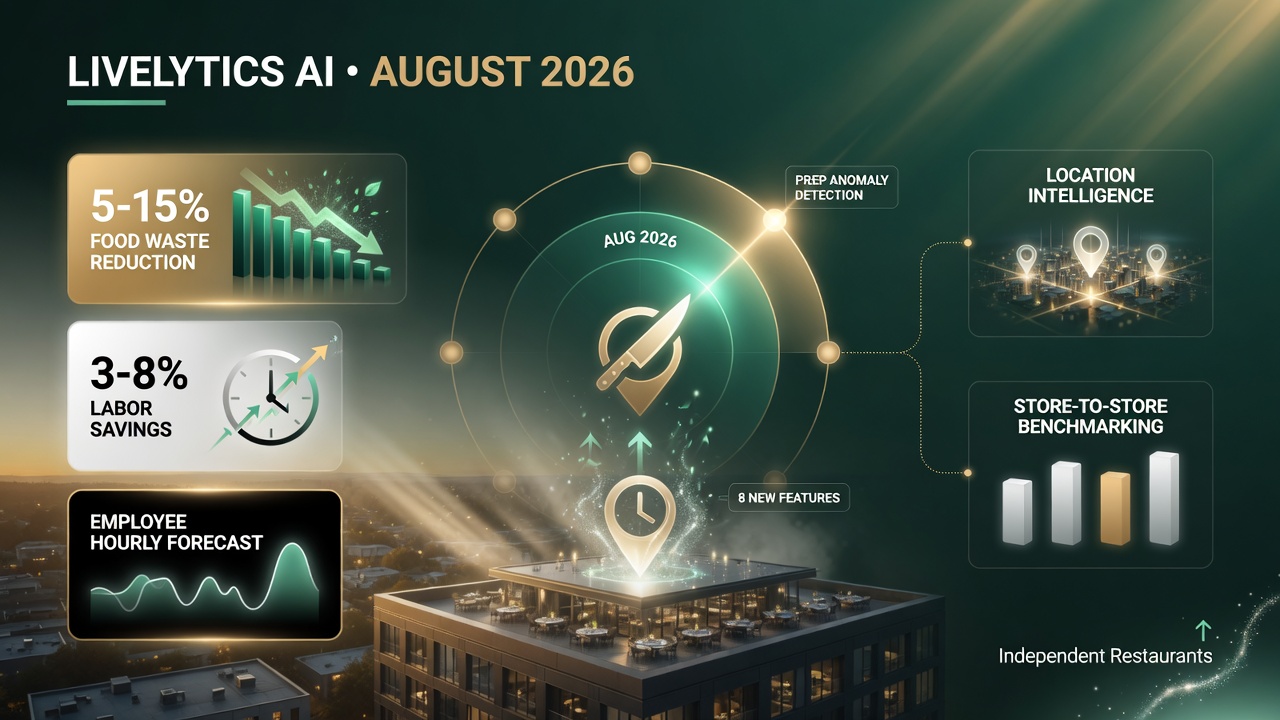
The headline of the August 2026 Livelytics update: eight new AI features — from Employee Hourly Forecast to Store-to-Store Benchmarking — aimed at the two biggest lines on a restaurant P&L: food waste and labor.
What’s New in the Livelytics August 2026 Release
The release adds eight new capabilities, and they cluster around two jobs: predict demand accurately, and control the two biggest variable costs, labor and food.
- Employee Hourly Forecast Report — predicts hourly labor needs so you schedule to actual demand, not to guesswork.
- Location Intelligence Report — gives each location its own view of performance, trends, and anomalies rather than one blended number.
- Prep Anomaly Detection — flags unusual prep patterns so waste does not quietly build up before you notice.
- Store-to-Store Benchmarking — compares locations against each other so you can see which sites are running tight and which are leaking.
- Hourly Product Forecast Report — predicts product-level demand by the hour so you prep the right amount of the right items.
- Hourly Labor Expense Report — tracks labor cost against forecast in near-real time across the day.
- Weekly Food Prep Strategy Report — turns forecast data into a concrete prep plan for the week.
- Enterprise Solution Health Center — monitors connected systems in real time so integrations are working when you need them.
Notice what all of these have in common: they are forward-looking. The hourly labor forecast is not telling you Tuesday ran over; it is telling you what Tuesday will look like so you can staff it correctly. The hourly product forecast is not telling you what you wasted; it is telling you how much of each item to prep.
Here is the full feature set at a glance:
| New Feature | What It Does | Why It Matters |
|---|---|---|
| Employee Hourly Forecast Report | Predicts hourly labor demand | Schedule to demand, not guesswork |
| Location Intelligence Report | Per-location performance view | Spot site-specific trends and problems |
| Prep Anomaly Detection | Flags unusual prep patterns | Catch waste before it compounds |
| Store-to-Store Benchmarking | Compares locations against each other | Find best practices to replicate |
| Hourly Product Forecast | Predicts product demand by the hour | Prep the right amount of each item |
| Hourly Labor Expense Report | Tracks labor vs forecast in real time | Keep labor cost on track all day |
| Weekly Food Prep Strategy | Turns forecast into a prep plan | Prep to actual weekly demand |
| Enterprise Solution Health Center | Monitors connected systems | Keep integrations working reliably |
The Numbers That Matter: Food Waste and Labor
Livelytics puts real numbers behind what these tools can do. According to the company, AI-powered insights can help restaurant leaders reduce food waste by 5–15% and achieve average labor savings of 3–8% across locations (Livelytics, August 2026). Those ranges are worth sitting with, because they are not tiny.
For a restaurant where food cost is one of the two or three biggest line items, cutting waste by even 10% is not a rounding error. It is real money that falls straight to the bottom line. And labor, which is usually the single largest controllable cost in a restaurant, dropping 3–8% on better scheduling is a meaningful margin improvement that requires no revenue increase to achieve.
That last point is the key insight for independent owners. You do not always have control over how many customers walk in. You have much more control over how efficiently you serve the customers who do come. Forecasting tools attack the cost side of the P&L, which is the side an owner can actually move on their own, without waiting for demand to improve.
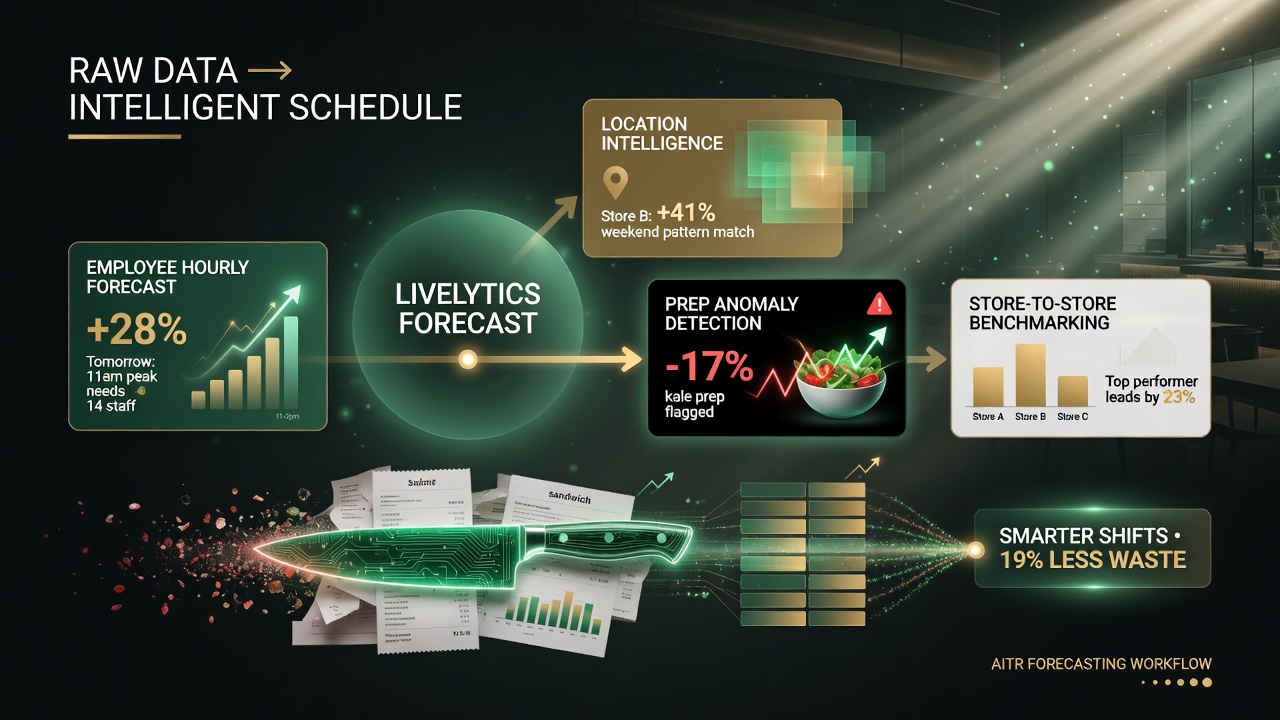
How Livelytics turns raw numbers into something actionable: sales and labor data flow into an AI forecast, which surfaces tomorrow\u2019s hourly staffing needs and flags prep anomalies before the waste builds up.
How AI Forecasting Beats Spreadsheet Guesswork
The honest question is: why is this better than the way you schedule and prep now? Most operators are not using nothing. They are using experience, last year’s numbers, and a fair amount of gut instinct, often tracked in a spreadsheet.
The problem with that approach is it cannot see patterns. A spreadsheet will not notice that the Tuesday after a local event consistently runs 20% over forecast, or that demand for a specific menu item spikes at a certain hour on weekends. A human manager tracking a handful of locations cannot hold all of that signal in their head.
AI forecasting, as Livelytics builds it, learns those patterns from the data and turns them into hourly predictions. It is not replacing the manager’s judgment. It is handing the manager a much better starting point, one that accounts for patterns a human would miss, so the manager’s experience is applied to the exceptions instead of the basics.
That is the real efficiency gain. You stop spending mental energy on the predictable stuff, which the AI handles, and you spend it where it matters, on the anomalies and the big decisions.
Prep Anomaly Detection: Catching Waste Before It Builds
One feature that deserves special attention for owners is Prep Anomaly Detection. Food waste rarely happens as one dramatic mistake. It usually happens as a quiet, compounding leak: you prep a little too much of the wrong thing, day after day, and it spoils. Nobody flags it because each individual day looks close to normal.
Anomaly detection watches for exactly that. It learns what normal prep looks like for each location and flags when something deviates, before the waste accumulates into a real cost. For a multi-location operator, this is the difference between catching a leak in one site in week one versus month three, when it has already drained a meaningful chunk of margin.
This is the kind of tool that pays for itself in the quiet way that matters: it does not generate a dramatic headline, it just stops money from leaking out across dozens of small daily decisions.
Store-to-Store Benchmarking for Multi-Location Owners
For owners running multiple locations, Store-to-Store Benchmarking is one of the most immediately useful additions. When you operate several sites, the hard part is not knowing your total. It is knowing which site is running well and which one is quietly underperforming, and why.
Benchmarking against your own locations gives you a fair comparison, because every site in your portfolio faces similar constraints and uses the same systems. When one location is running labor at 3% better than its peers with no drop in service, you have a template for what the others should be doing. When one location is wasting materially more food, you have a specific problem to investigate rather than a vague concern.
This turns your own network into a control group and a performance lab, which is exactly how a chain gets better. An independent owner with two or three locations can apply the same discipline without needing a corporate analytics department.
Forecasting vs. Traditional Reporting: A Side-by-Side
To make the difference concrete, here is how forecasting stacks up against the kind of backward-looking reporting most owners have been using:
| Decision | Traditional Reporting | Livelytics Forecasting |
|---|---|---|
| Staffing | Hire based on last week’s mistakes | Schedule to predicted hourly demand |
| Food prep | See what spoiled after the fact | Prep the right amount before service |
| Multi-location | One blended total hides site problems | Benchmark each site against peers |
| Waste | Detect leaks in month three | Flag anomalies in week one |
Every row is the same story: reporting tells you about the damage after it is done, forecasting helps you prevent it in the first place. That is the entire value of the shift.
A Practical Look at the Hourly Forecast Reports
The two hourly reports in the release, the Employee Hourly Forecast and the Hourly Product Forecast, are worth calling out specifically because they go where most analytics never do: down to the hour.
Most scheduling today is done in daily or weekly blocks. You predict that Tuesday is a medium day and you staff it accordingly, with a buffer because you are not sure. That buffer is exactly where labor overage hides. When you schedule to an hourly forecast instead, you staff up for the lunch spike, staff down after it passes, and you do not pay people to stand around in the dead afternoon hours just because the daily average said you should.
The hourly product forecast works the same way on the food side. You know from the forecast that appetizers spike at 6 p.m. and desserts tail off by 9 p.m., and you prep accordingly. You stop making too much of the slow items and not enough of the fast ones, which is the pattern that produces both waste and disappointed customers when an item sells out.
Combined, the two hourly reports attack the exact moment where cost is locked in: the hour. That is finer-grained than the weekly reporting most owners are used to, and it is where the 5–15% waste reduction and 3–8% labor savings are actually won.
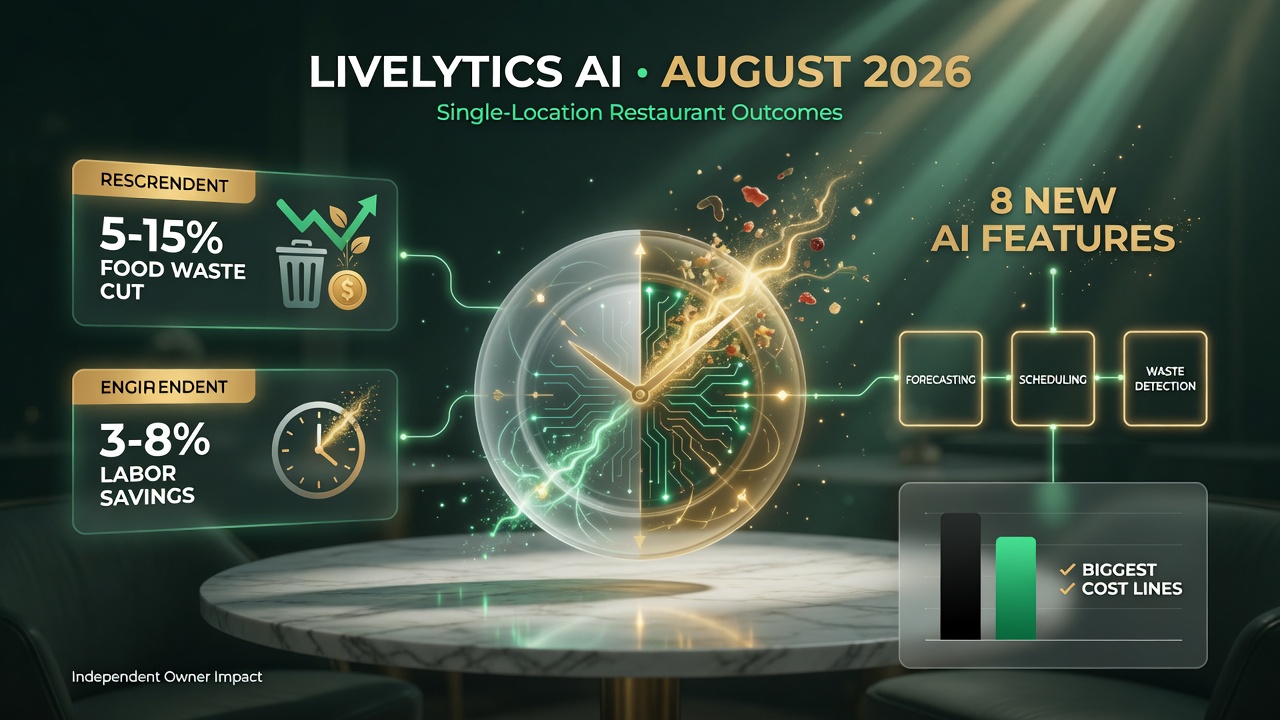
The reason an independent owner should pay attention: a forecast-and-detect system targeting a 5-15% food waste cut and a 3-8% labor saving hit precisely the cost lines that decide whether an independent restaurant turns a profit.
What This Means for US Restaurant Owners
Whether or not Livelytics is the right fit for your operation, the release signals where restaurant technology is heading, and it is worth understanding so you can evaluate any tool you consider:
- Forecast before you act. The vendors winning the market are the ones predicting demand and cost, not just reporting them. Ask any analytics tool what it forecasts, not just what it reports.
- Labor and food are the targets. The biggest wins in restaurant efficiency are labor and food cost. A tool that does not tackle at least one of these is not attacking your real margin problem.
- Hourly granularity matters. Daily or weekly forecasts are too coarse. The useful number is hourly, because that is how you staff and prep.
- Benchmark your own locations. Your best comparison is your own portfolio. Tools that make that easy are more useful than tools that stop at a blended total.
For a single independent restaurant, some of Livelytics’ multi-location features may be more than you need right now. But the forecasting logic, the anomaly detection, and the focus on labor and food waste apply to any size operation. And for an owner expanding to a second or third location, the store-to-store benchmarking alone can justify the attention.
The Bottom Line
The restaurant analytics market is shifting from telling you what went wrong to predicting what is coming so you can prevent it. Livelytics’ August 2026 release is a clear example, with hourly forecasting, prep anomaly detection, store-to-store benchmarking, and a stated 5–15% food-waste reduction and 3–8% labor-savings target. For US restaurant owners, the practical takeaway is to stop paying for reports that document your losses after the fact, and start using tools that help you make the staffing and prep decisions right the first time.
Frequently Asked Questions
What is new in the Livelytics August 2026 release?
The release adds AI forecasting and cost-control tools for multi-location restaurants, including an Employee Hourly Forecast Report, Location Intelligence Report, Prep Anomaly Detection, Store-to-Store Benchmarking, Hourly Product Forecast Report, Hourly Labor Expense Report, Weekly Food Prep Strategy Report, and an Enterprise Solution Health Center.
How can Livelytics reduce food waste?
Livelytics uses AI-powered forecasting and prep anomaly detection to predict product-level demand and flag unusual prep patterns, which it says can help restaurants reduce food waste by 5–15%.
How much labor can Livelytics help save?
Livelytics says its AI-powered insights can achieve average labor savings of 3–8% by forecasting hourly demand so operators schedule staff to actual need rather than guesswork.
Is Livelytics only for large restaurant chains?
Livelytics is designed for multi-location restaurant businesses, but its forecasting and cost-control logic applies to operations of any size, and store-to-store benchmarking is especially useful for owners expanding to multiple locations.
What is the difference between forecasting and reporting in restaurant analytics?
Reporting documents what already happened, which is too late to change staffing and prep decisions. Forecasting predicts future demand and cost so operators can make the right decisions before the labor and food costs are locked in.

About Barak Schurr
Barak Schurr built and exited a major ticketing platform, ran global operations at Eventbrite, and now focuses on one question: which AI tools actually help independent restaurant owners run leaner and grow faster. He writes from the operator’s perspective — no vendor spin, no theory, just what’s real in 2026.
Email: [email protected]
More Resources for Restaurant Operators