Get the AI Restaurant Quick-Start Guide — Free
The 5 AI tools independent US restaurant owners are using right now to cut labor costs and answer every call.
Livelytics AI Restaurant Analytics: August 2026 Release
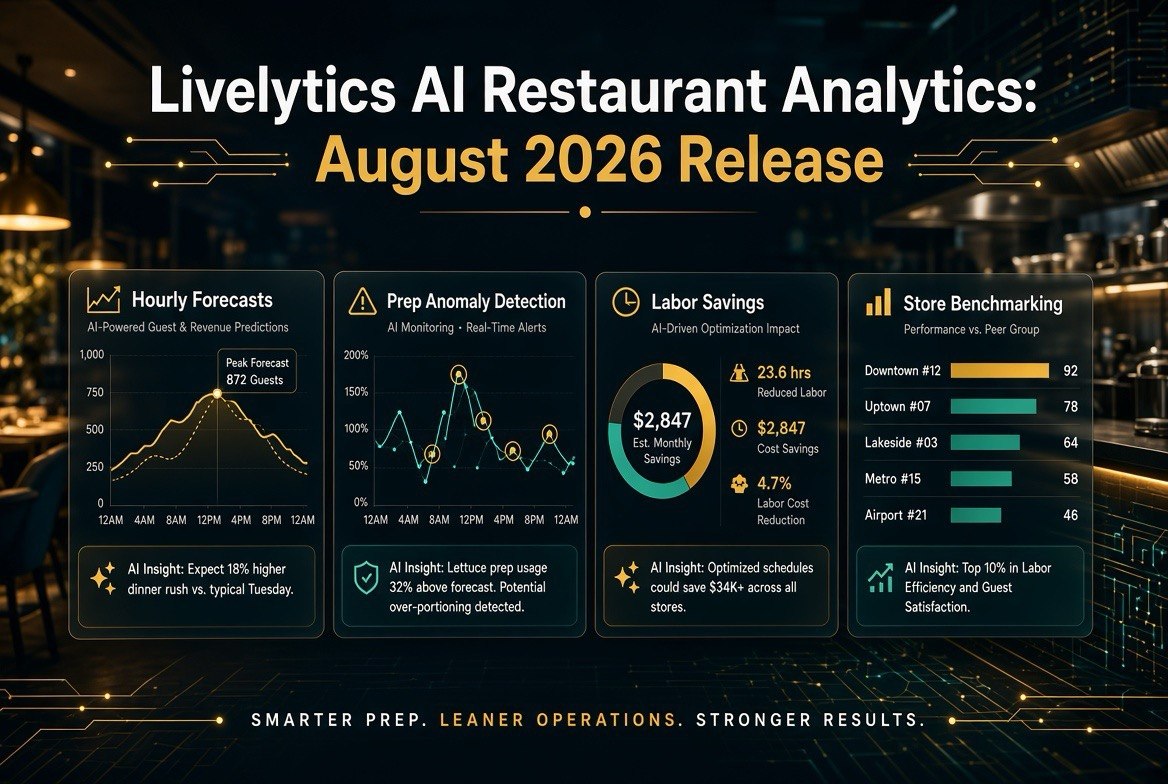
⚡ Expert Summary: Livelytics rolled out its August 2026 product release for multi-location restaurant operators, adding AI-driven forecasting and cost-control tools: hourly forecast reports, prep anomaly detection, store-to-store benchmarking, and more. The company says the platform can reduce food waste by 5-15% and deliver average labor savings of 3-8% — real numbers worth stress-testing against your own operation. For independent owners and small groups, the value is less about the specific features and more about the pattern: restaurant analytics is moving from rearview reports to forward-looking, AI-driven forecasting.
What Livelytics Announced in the August 2026 Release
Livelytics, a restaurant analytics and AI insights platform, shipped its August 2026 product release aimed at multi-location restaurant businesses. The company frames the release around a simple premise: restaurant leaders need more than reports — they need clear, timely answers that improve everyday decisions. The update is built around forecasting, cost control, and operational performance. If you are scanning your options in this category, start with our restaurant AI hub, which lays out the tools that actually move the needle for independent operators.
The release adds eight new capabilities, and it is worth listing them because together they sketch where restaurant analytics is heading:
- Employee Hourly Forecast Report — predicts staffing needs by hour rather than by day or week.
- Location Intelligence Report — compares performance across different sites in a group.
- Prep Anomaly Detection — flags prep quantities that fall outside expected ranges.
- Store-to-Store Benchmarking — sets a performance baseline across locations.
- Hourly Product Forecast Report — forecasts demand for specific items by hour.
- Hourly Labor Expense Report — tracks labor cost against sales on an hourly basis.
- Weekly Food Prep Strategy Report — lays out a week-ahead prep plan based on forecast.
- Enterprise Solution Health Center — monitors that connected systems are running correctly.
Several of these fall into two buckets that operators should care about most: hourly precision (forecasting and labor tracked down to the hour, not just the shift) and anomaly detection (the system flagging prep or cost outliers before they become waste or shrinkage).
Why Hourly Forecasting Changes the Game
Traditional restaurant forecasting works at the day or shift level. You estimate that Friday will be busier than Tuesday, and you staff and prep accordingly. The Livelytics release pushes this to an hourly level — predicting both employee needs and product demand for each hour of service.
That granularity matters more than operators often realize, for two reasons. First, labor is one of the largest cost lines in a restaurant — typically 28-35% of sales at independent operations. If you overstaff a slow 2:00 PM to 4:00 PM window, that is pure cost you did not need. Hourly labor forecasting lets you match staffing to actual demand curves rather than weekly averages.
Second, prep waste follows the same curve. If you prep a fixed quantity every morning regardless of what the day actually brings, you either run out during a rush or throw out product in the lull. Hourly product forecasting, combined with prep anomaly detection, is designed to flag when your prep quantities drift from what the forecast says you will sell — catching waste and shrink before they compound.
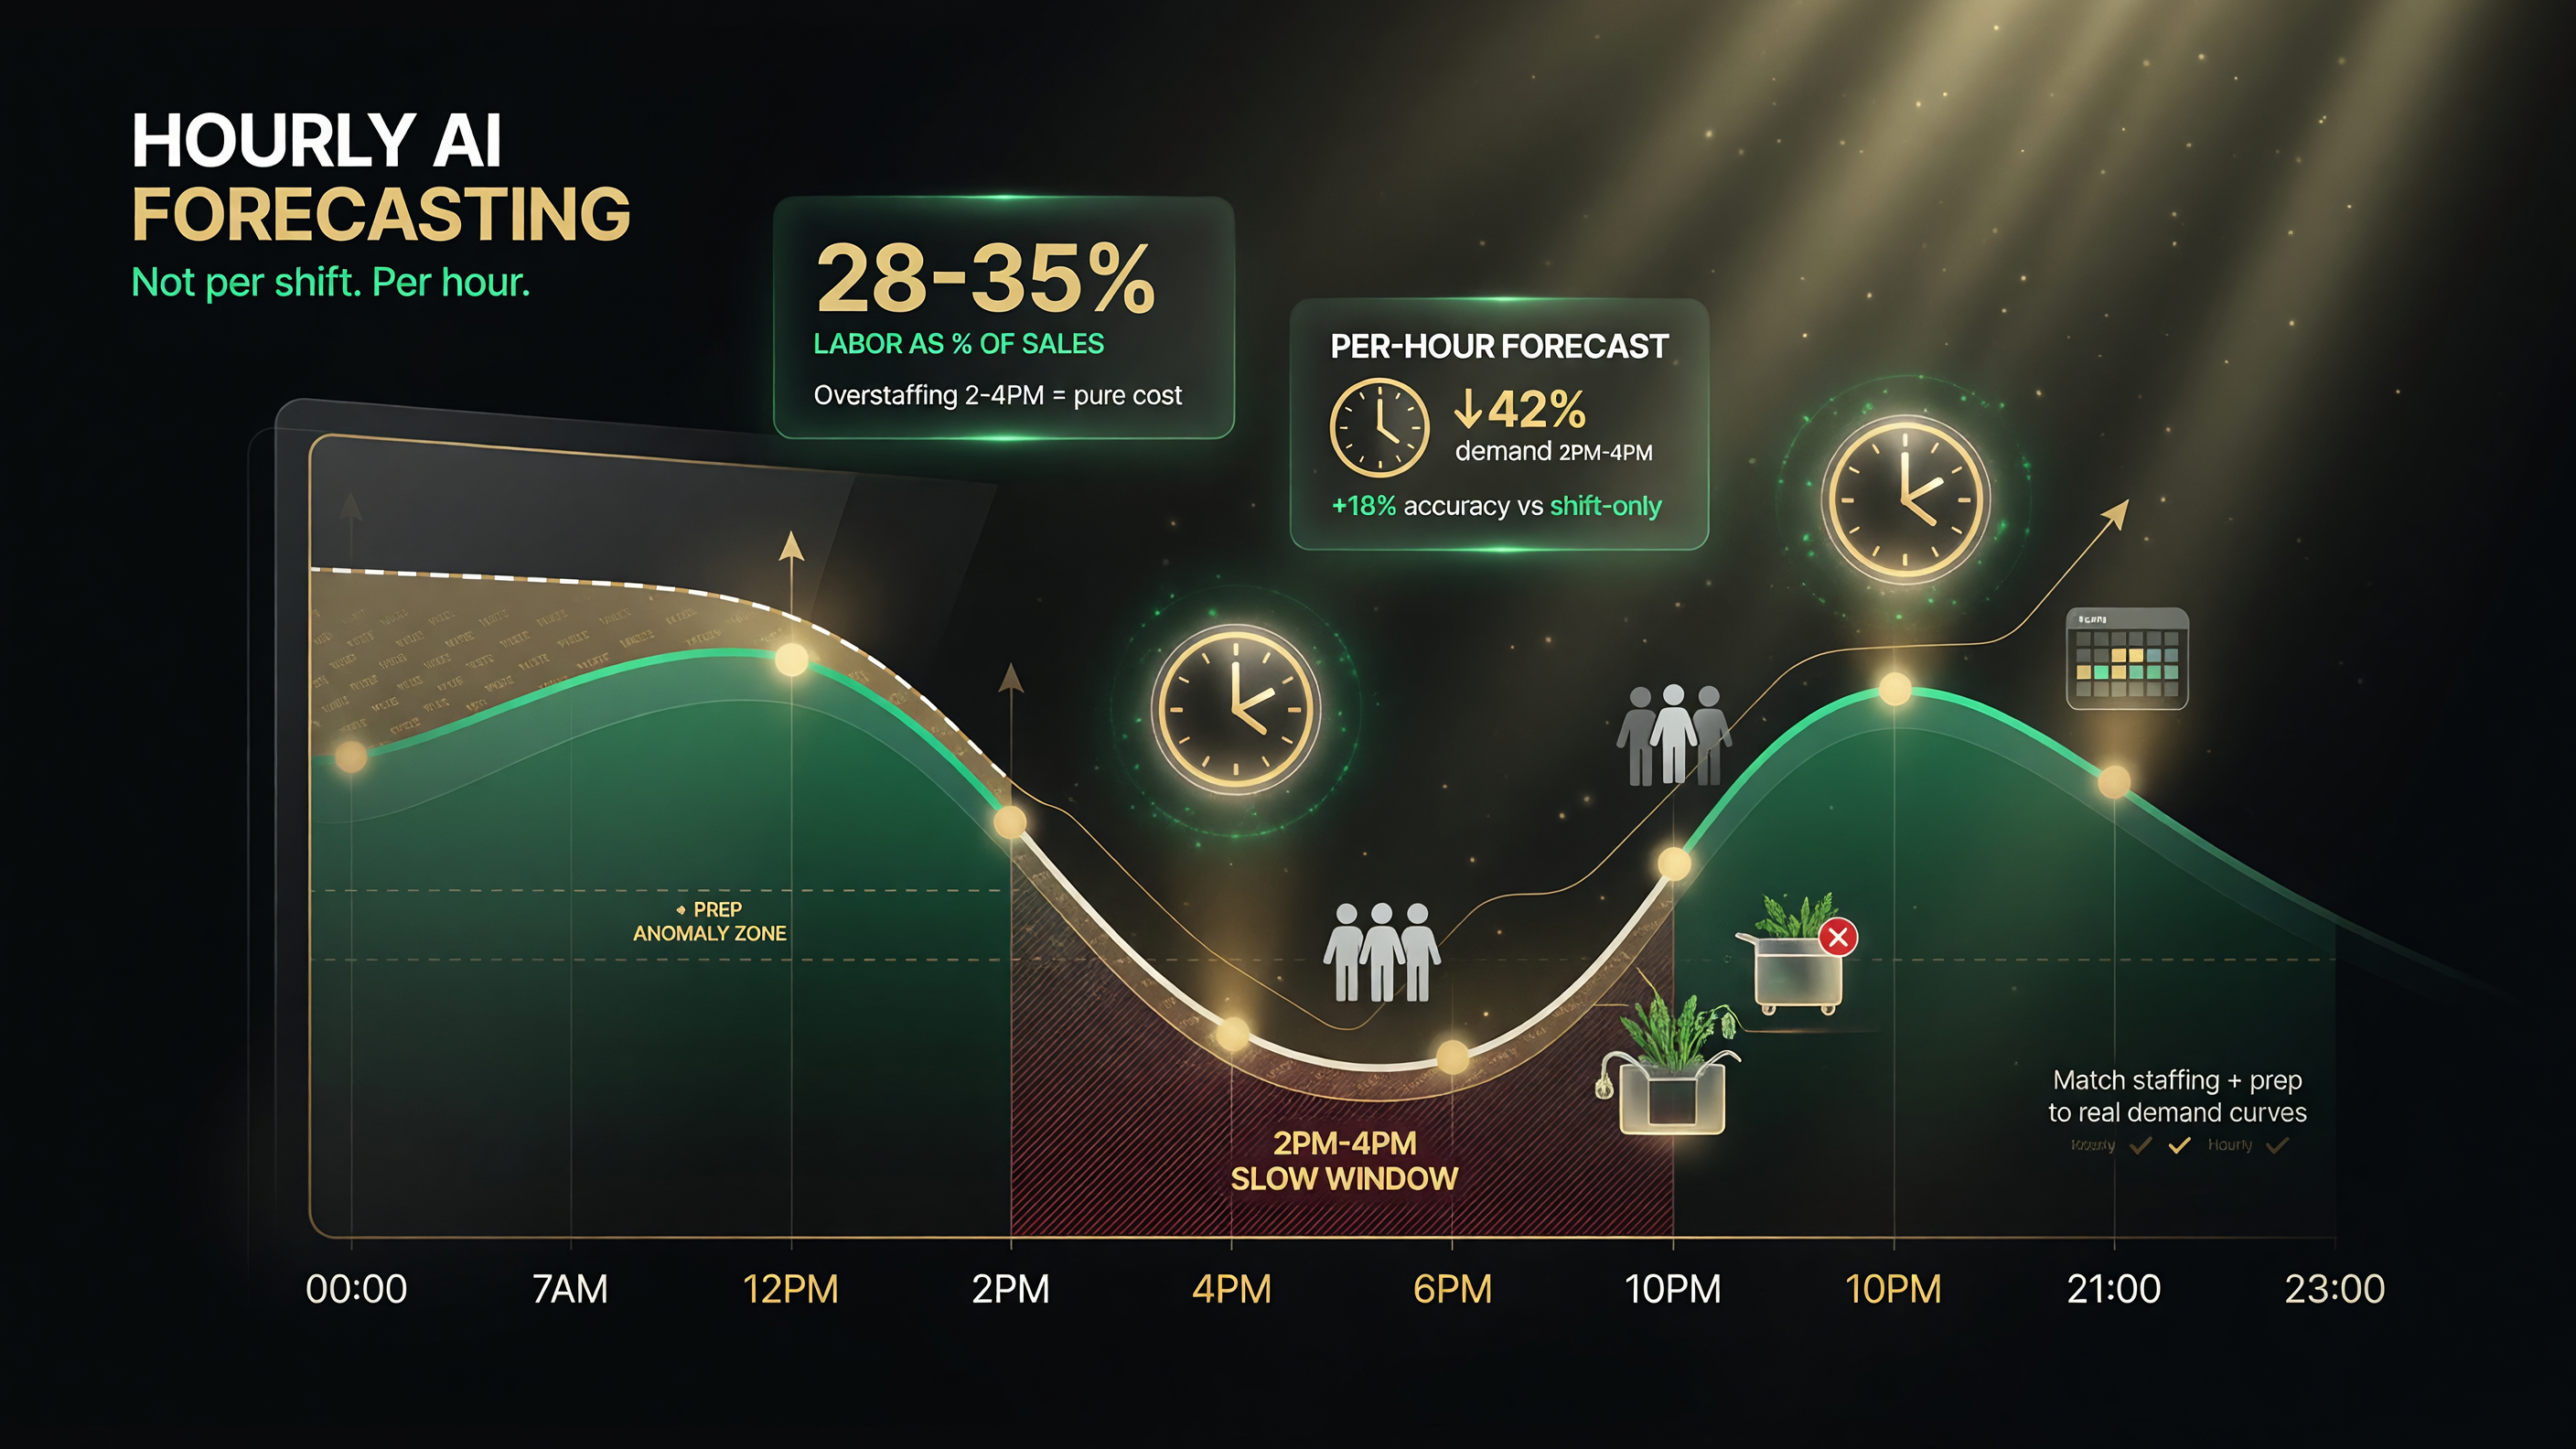
Hourly forecasting matches staffing and prep to the real demand curve — overstaffing a slow 2PM-4PM window is pure cost when labor runs 28-35% of sales.
The Numbers Behind the Claims
Livelytics cites three outcome figures for operators using the platform:
| Claimed Outcome | Ranges Cited | How to Read It |
|---|---|---|
| Food waste reduction | 5-15% | Vendor-reported range; verify against your own baseline |
| Labor savings | 3-8% average | Best case assumes accurate forecasting and active adjustment |
| Forecast accuracy | Improvement across locations | Qualitative claim; benchmark your own variance before and after |
To be clear about sourcing: these figures come from Livelytics’ own release materials, not an independent study. That does not make them worthless — vendor-reported ranges are a reasonable place to start when evaluating software — but you should treat them as a target to test, not a guaranteed outcome. The honest approach is to run the numbers against your own operation for a month before committing.
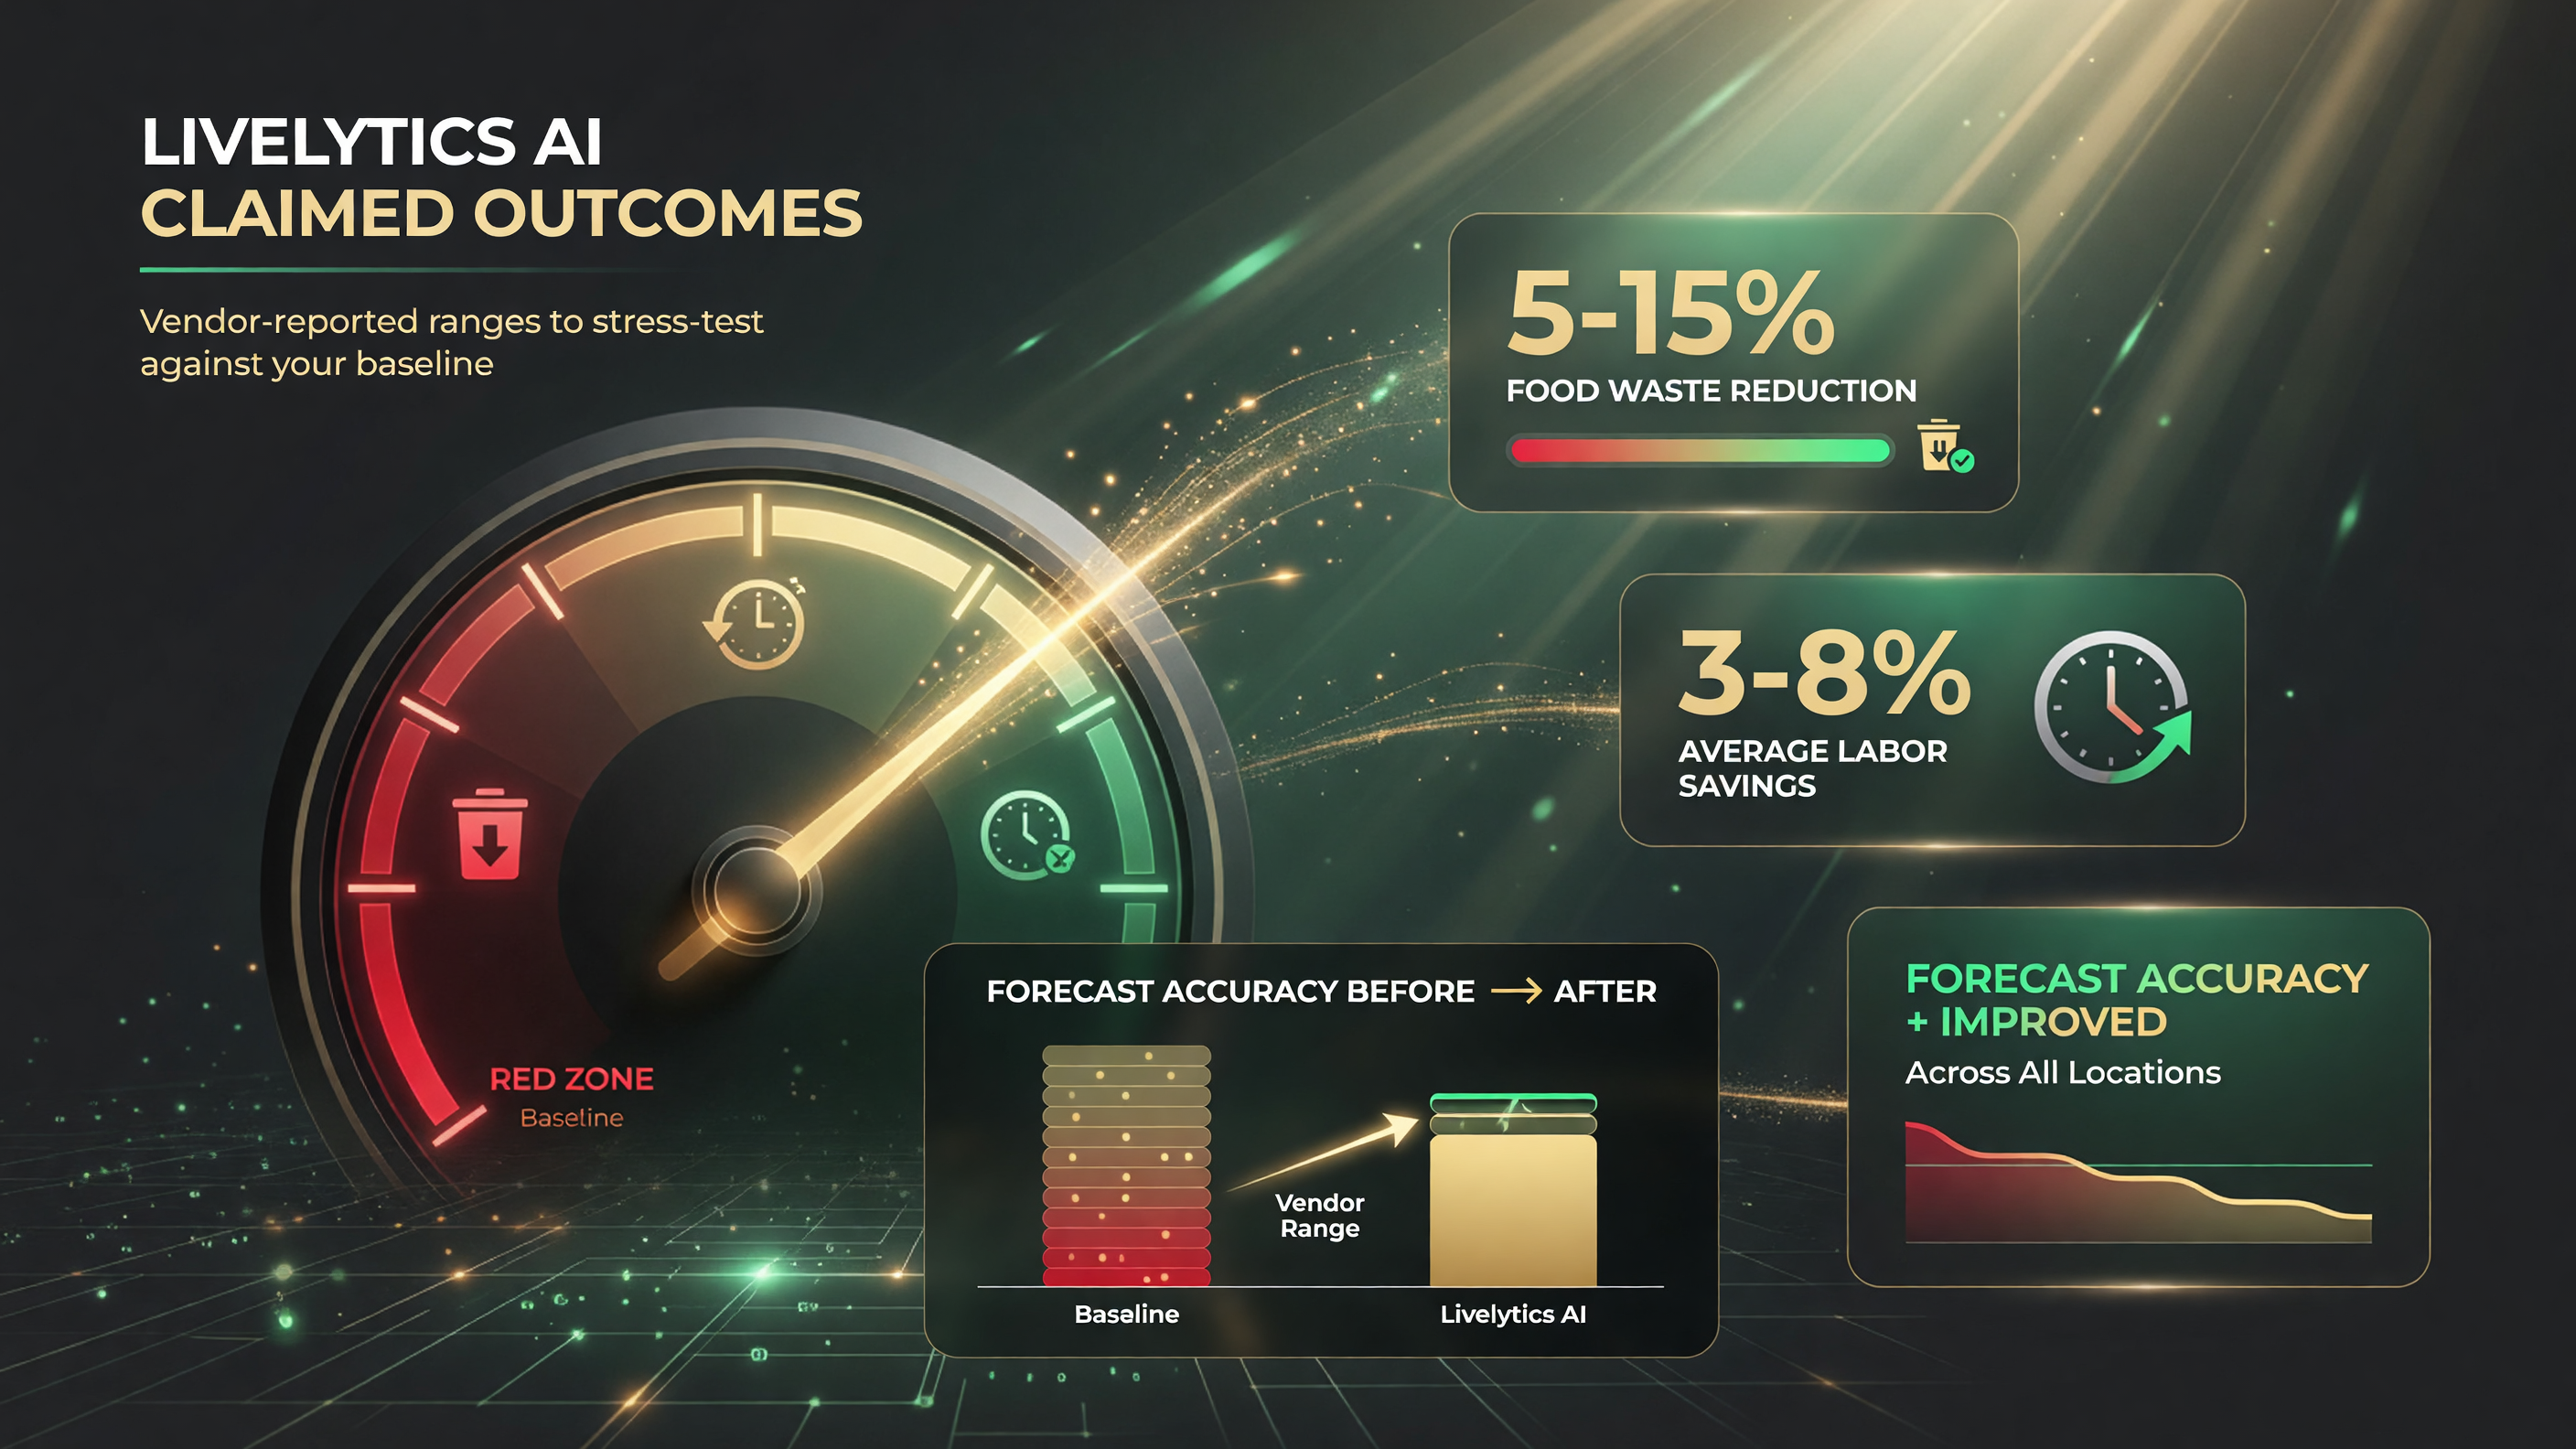
Livelytics’s three claimed outcomes — 5-15% waste reduction, 3-8% labor savings, better forecast accuracy. Vendor-reported ranges, so stress-test them against your own baseline.
What the Feature Set Actually Means for Independent and Small-Group Operators
Livelytics’ positioning is clearly aimed at multi-location restaurant businesses — the product name itself, along with features like store-to-store benchmarking and the enterprise health center, assumes you run several sites. That raises an honest question for an independent single-unit owner: is this overkill?
The answer depends on scale. A two-to-five-location operator is exactly the sweet spot for many of these features, because comparisons between stores surface problems that are invisible at a single unit. You can benchmark one location against another, spot a prep-cost outlier at one site, and see where labor is drifting. For a single independent restaurant, the hourly forecasting and prep-anomaly pieces still add value — they go after the two biggest controllable costs (labor and food) — but the benchmarking and enterprise components may be more than you need.
If you run a small group, the practical recommendation is to evaluate Livelytics alongside the general-purpose restaurant analytics tools you may already use (POS analytics, a BI dashboard like the one your Toast or Square stack includes). The question is not whether AI forecasting sounds impressive — it is whether the hourly precision and anomaly flags meaningfully change a decision you make every week.
The Pattern: Analytics Is Moving From Reports to Forecasts
The broader signal in this release is worth more than any single feature. Restaurant analytics is shifting from describing the past to predicting the future. The older generation of tools answered “what happened last month?” with a dashboard. The newer generation is answering “what should I do about next Friday?” with forward-looking forecasts and anomaly flags.
That shift matters because it changes how the tool helps you. A report tells you after the fact that labor ran over budget. An anomaly detection system flags a prep quantity that looks off before it becomes waste — while there is still time to act. For a margin-thin independent operation, acting before the problem lands is where real savings come from.
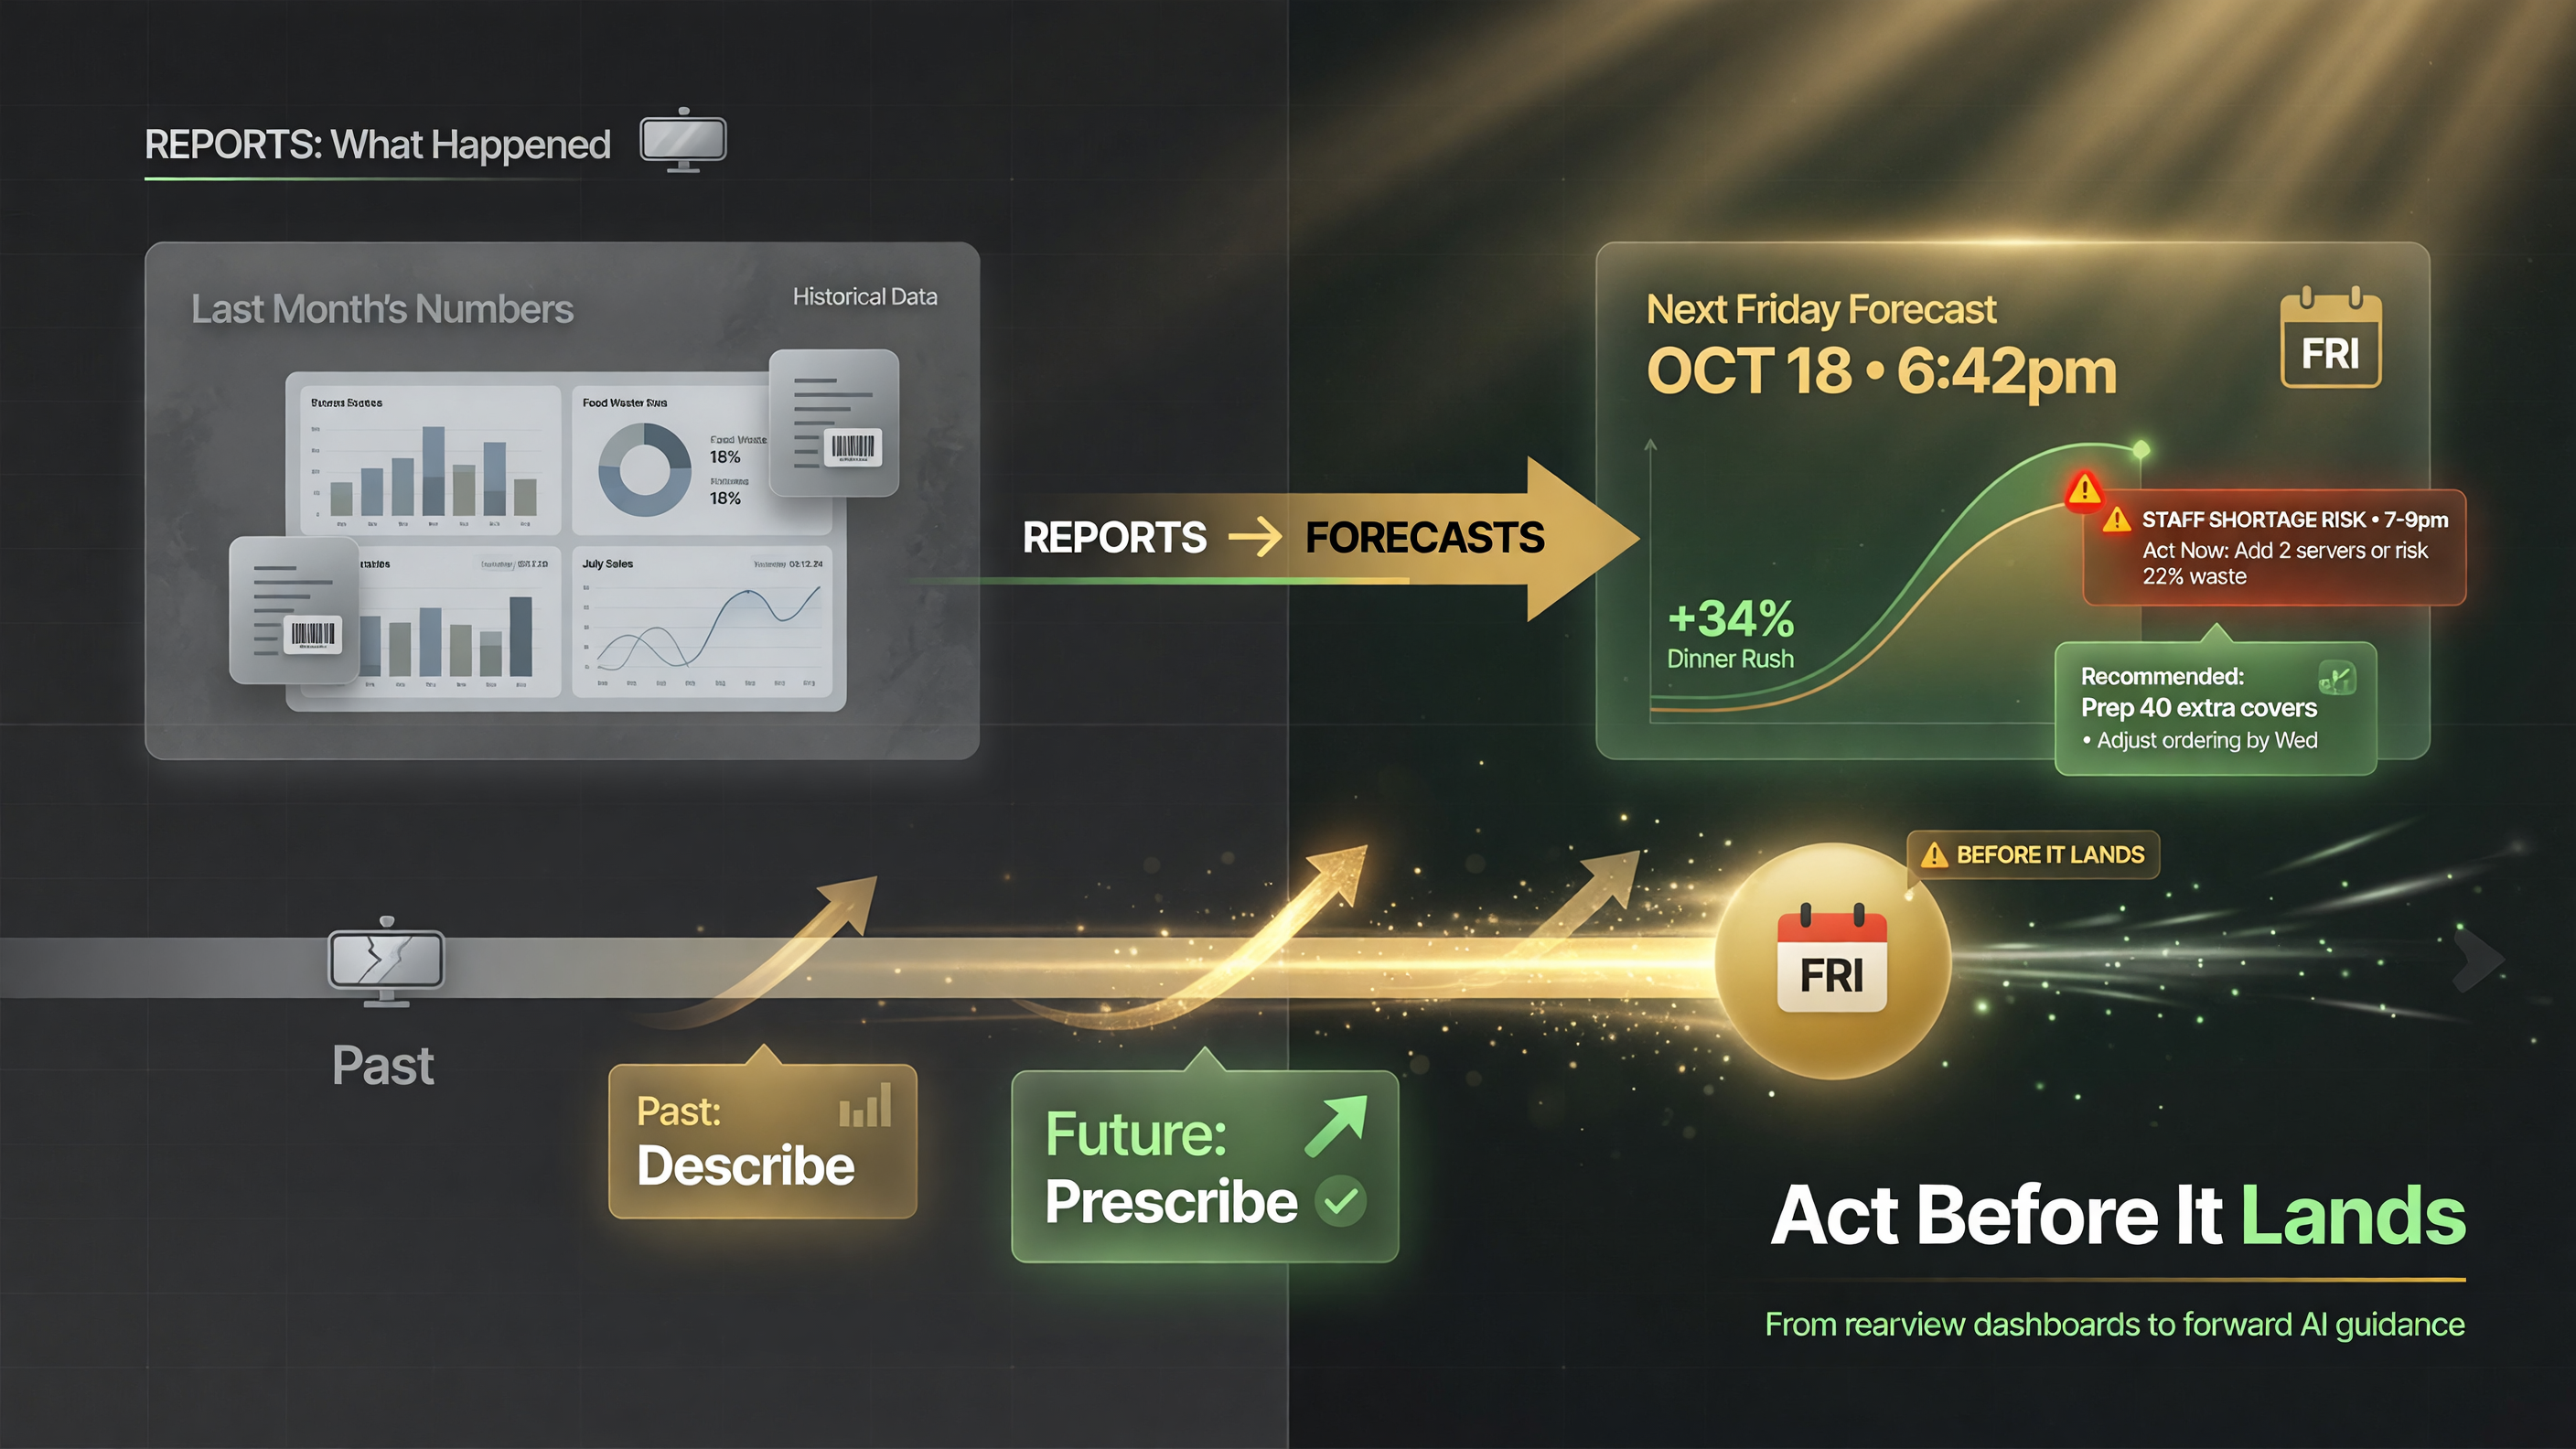
Analytics is moving from reports (what happened last month) to forecasts (what to do about next Friday) — acting before the problem lands is where real savings come from.
This is also where the AI angle is genuinely useful rather than tacked on. The value is not a chatbot answering questions about your sales. It is the system learning your demand patterns, your seasonal curves, and your store variance, then making the forecast more accurate over time. That is the definition of an AI capability that pays for itself if the tool is good.
How to Evaluate Livelytics (or Any AI Analytics Tool) for Your Operation
Before you request a demo, here is a short evaluation framework that applies to Livelytics and to any vendor making similar claims:
- Ask where the numbers come from. If a vendor claims 5-15% waste reduction, ask for a case study showing a restaurant like yours reaching that range — not a marketing average.
- Check the integration. Does the tool plug into your POS and workforce-management systems, or will you have to re-enter data? Weak integration kills adoption.
- Test forecast accuracy on your own data. Ask for a trial on your real sales history, then compare the model’s forecast against what actually happened over a few weeks.
- Weigh the labor cost of the tool. A forecasting platform only helps if your team acts on it. The best forecast in the world is worthless if nobody changes the prep sheet or the schedule.
- Start with one store. If you run multiple locations, pilot on your single most consistent unit to see whether the insights transfer before rolling out everywhere.
The most common reason restaurant analytics software disappoints is not a bad product — it is a good product that nobody is trained to use, or that is not wired to the actual decision cadence of the operation. Budget for adoption, not just the license.
The Costs You Are Trying to Control
It helps to anchor all of this in real restaurant economics. For most independent operators, the two biggest controllable cost lines are labor and food cost. Labor typically runs 28-35% of sales, and food cost commonly lands around 30%. Together they are the majority of every dollar you take in. Tools that attack these two lines directly — hourly labor forecasting and prep/waste reduction — are attacking the place where margin is won or lost.
| Cost Line | Typical Share of Sales | How AI Forecasting Helps |
|---|---|---|
| Labor | 28-35% | Hourly forecast matches staffing to demand, cuts overstaffing |
| Food cost | ~30% | Hourly product forecast + prep anomaly detection cut waste |
If your goal is simply to improve margins, anchor every vendor conversation to these two numbers. A tool that demonstrably shaves a point or two off labor or food cost pays for itself quickly. A tool that only produces prettier reports does not.
The Real Reason Forecasting Tools Fail
If AI forecasting is so valuable, why do so many restaurant operators abandon these platforms after a few months? It is rarely the software. It is almost always one of three adoption failures that you can avoid before you spend a dollar.
First, the tool is not wired to the decision. A forecast only creates value if someone changes behavior based on it — adjusting the prep sheet, shifting a schedule, reordering a par level. If the forecast lands in a dashboard that nobody opens at the moment of the decision, it is decoration. The best restaurants connect the forecast to the weekly prep meeting and the schedule build, so the output becomes an input to an existing ritual rather than a separate step.
Second, the baseline is wrong. If your historical data is messy — inconsistent menu changes, poor hour-by-hour sales capture, unlabeled promotions — the model’s forecasts inherit that noise. Garbage in, garbage out applies to AI as much as to any spreadsheet. Clean your data and standardize how you record items and hours before you expect accurate hourly forecasts.
Third, no one owns the outcome. A GM who is accountable for staying inside forecasted labor hours will use an hourly labor report. A GM who merely receives it will not. Assign ownership of the forecast-to-action loop, or the cycle never closes. This is the difference between a tool that pays for itself and one that becomes another unused subscription.
Keep these three failure modes in mind when you evaluate Livelytics or any AI analytics vendor. The features matter, but the adoption plan around them matters more.
Should You Request a Demo?
Livelytics is requesting demo inquiries at livelytics.ai, so the barrier to evaluating it is low. Whether you should take them up on it depends on your situation:
- Multi-location operators: Yes — the benchmarking, location intelligence, and hourly forecasting features target exactly your problems. This is your category.
- Single-unit independents: Maybe — the hourly forecasting and prep-anomaly pieces are valuable, but you can likely get equivalent wins from your existing POS analytics plus disciplined forecasting first.
- Operators without forecasting discipline: Fix the baseline first. If you are not already reviewing forecasts weekly, software will not substitute for the habit.
The bottom line: Livelytics’ August 2026 release is a solid representative of where restaurant analytics is headed — AI-driven, hourly, forward-looking, and aimed at the two costs that decide your margin. Whether it is right for you comes down to your scale and your willingness to act on the signals, not the length of the feature list.
FAQ
What is Livelytics?
Livelytics is a restaurant analytics and AI insights platform for multi-location restaurant businesses. Its August 2026 release adds hourly forecasting, prep anomaly detection, store-to-store benchmarking, and related operational tools.
What new features did Livelytics add in August 2026?
The release added eight capabilities: Employee Hourly Forecast Report, Location Intelligence Report, Prep Anomaly Detection, Store-to-Store Benchmarking, Hourly Product Forecast Report, Hourly Labor Expense Report, Weekly Food Prep Strategy Report, and Enterprise Solution Health Center.
Can Livelytics reduce food waste and labor costs?
Livelytics reports that its platform can reduce food waste by 5-15% and achieve average labor savings of 3-8%. These are vendor-reported figures, so operators should stress-test them against their own operation before committing.
Is Livelytics right for independent restaurants?
It depends on scale. Multi-location operators benefit most from benchmarking and location intelligence. Single-unit independents may find the hourly forecasting and prep-anomaly detection valuable, but should compare against their existing POS analytics first.
Where can I get a Livelytics demo?
Livelytics accepts demo requests through its website at livelytics.ai.

About Barak Schurr
Barak Schurr built and exited a major ticketing platform, ran global operations at Eventbrite, and now focuses on one question: which AI tools actually help independent restaurant owners run leaner and grow faster. He writes from the operator’s perspective — no vendor spin, no theory, just what’s real in 2026.
Email: [email protected]
More Resources for Restaurant Operators