Get the AI Restaurant Quick-Start Guide — Free
The 5 AI tools independent US restaurant owners are using right now to cut labor costs and answer every call.
Sightline OS Launches Continuity AI: Stop Restaurant Stockouts Before They Happen
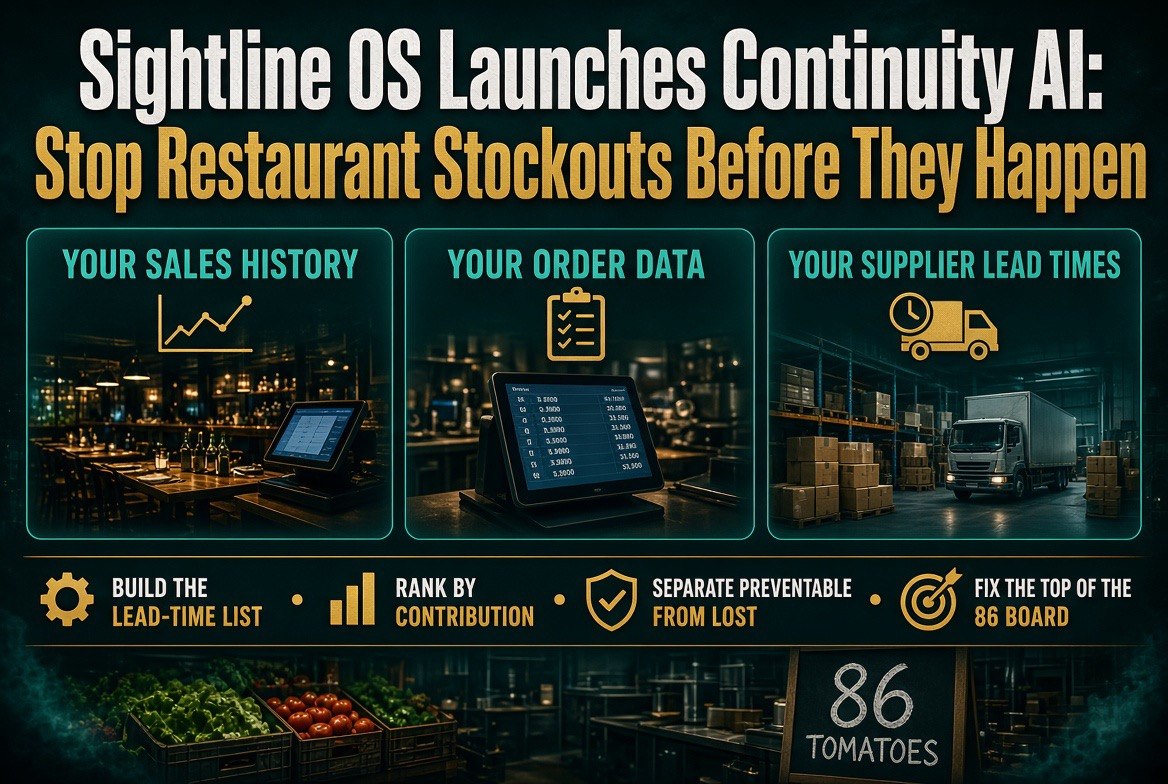
⚡ Expert Summary: On September 15, 2026, Sightline OS launched Continuity AI, a reasoning engine inside its restaurant supply chain platform that flags supply gaps up to 12 weeks ahead, scores each one 0–100 for severity, tells you whether it is still preventable, and recommends the exact next action — including how many cases to order and when. The platform’s customers include Bonchon, Din Tai Fung, L&L Hawaiian BBQ, and Goop Kitchen. For independent operators the real lesson is not the software; it is that the same three inputs — your own sales history, your order data, and your supplier lead times — can stop the 86’ing problem without a six-figure system.
Every restaurant operator knows the feeling. It is 6:40 on a Friday, the board is full, and a server comes back from the line with the sentence that costs you money in three directions at once: we’re out of it. The guest is disappointed, the server is embarrassed, the kitchen has to improvise, and you have just donated a ticket to the restaurant down the street. It is the single most avoidable revenue leak in the business and the one most operators simply accept as weather.
On September 15, 2026, a New York company called Sightline OS launched a product that attacks that exact moment. Continuity AI is a reasoning engine built into the company’s inventory and supply chain platform. It carries a blunt promise in the press release headline: turning restaurant stockouts from a crisis into a non-event. The claim is not that it eliminates shortages. It is that it tells you which ones are coming, which ones still matter, and what to do today about the ones you can still save.
What Continuity AI Actually Does
Continuity AI activates automatically the moment the platform flags an inventory escalation. It is not a dashboard you have to remember to open. For every issue it produces five specific outputs, and the specificity is the point.
The first is an Early Warning plus Forward Scan. The engine flags products already out of stock or trending toward it based on available supplier lead times, then scans ahead for additional stockouts hiding later in the planning horizon. That second half matters more than the first: most operators can see that they are out of something today. Almost none can see that a different item runs dry three weeks from now.
The second is an Impact Score from 0 to 100, paired with a Critical, High, Medium, or Low label. This is the answer to the question every supply chain manager faces on a Monday morning — with eleven open issues, which one do I work first.
The third is a Mitigation Outlook that classifies each issue as Preventable, Partially Preventable, or Unavoidable. That distinction is the most operationally useful thing in the launch. It stops teams from pouring hours into a gap that is already lost while a fixable one decays in the queue.
The fourth is a Next Best Action — a concrete recommendation such as placing a new order or expediting one already in transit, sized to the exact number of cases needed. Not “consider increasing safety stock.” A number of cases.
The fifth is Recommended Timing, which reflects delivery reality so you know whether an action can still land in time to matter.
Perhaps the sharpest design choice is that the engine separates a temporary blip from a systemic supply gap. A stockout with an inbound order already resolving it scores far lower than a prolonged outage with more stockouts looming behind it. That is what converts a raw alert feed into an honest prioritization tool — and it is the difference between a system operators trust and one they mute.
The Problem It Is Built To Solve
The press release is candid about the status quo, and the description will be familiar to anyone who has stood in a back-of-house office at 7 AM. For supply chain teams, figuring out why a menu item is out of stock — and what to do about it — is still largely a manual process. There is no consistent way to quantify risk, no simple way to separate the disruptions that are still fixable from those that are already lost, and by the time a team understands the root cause, they are reacting to an outage in progress rather than preventing the next one.
The cost compounds along three lines: lost revenue when guests cannot order what they want, brand erosion from repeat disappointment, and supply chain staff stuck firefighting instead of planning. The third is the one operators underrate, because it is a payroll cost rather than a lost-sale cost, and it shows up as burnout and turnover rather than a line on a P&L.
The scale of the underlying problem is well documented across the industry. Food waste and spoilage have long been measured in the tens of billions of dollars annually for American food service, and out-of-stock events sit on the other side of the same broken forecasting coin — one is product you bought and threw away, the other is demand you could not serve. Both are symptoms of ordering on instinct.
What Bonchon’s Numbers Show
The most concrete evidence in the launch comes from a customer, not a slide. Bonchon, the Korean fried chicken franchise with more than 150 restaurants, has been running the platform across a network of 35 distributor operating companies. Since implementing it, Bonchon’s system-wide weighted average distributor fill rate rose 1.1 percent to reach 99.3 percent, while product substitutions dropped dramatically.
A 1.1 point move sounds small until you attach it to the right denominator. Fill rate is the share of ordered product that actually arrives. At 98.2 percent, roughly one in fifty-five line items fails; at 99.3 percent, closer to one in a hundred and forty. Across a network that size, that is not a rounding error in anybody’s week — it is the difference between a substitution conversation on the line and a menu item that simply works.
Suzie Tsai, CEO of Bonchon, described the change in operational terms: greater visibility across the distribution network and stronger forecasting let the team identify potential inventory challenges earlier, collaborate more effectively with partners, and improve supply reliability for franchisees. Translated: fewer disruptions, better guest experience. Yusha Hu, co-founder and CEO of Sightline OS, came to the problem from the truck-driving side of the business before leading supply chain teams at large restaurant organizations — a background that shows in a product built around delivery timing rather than analytics vanity.
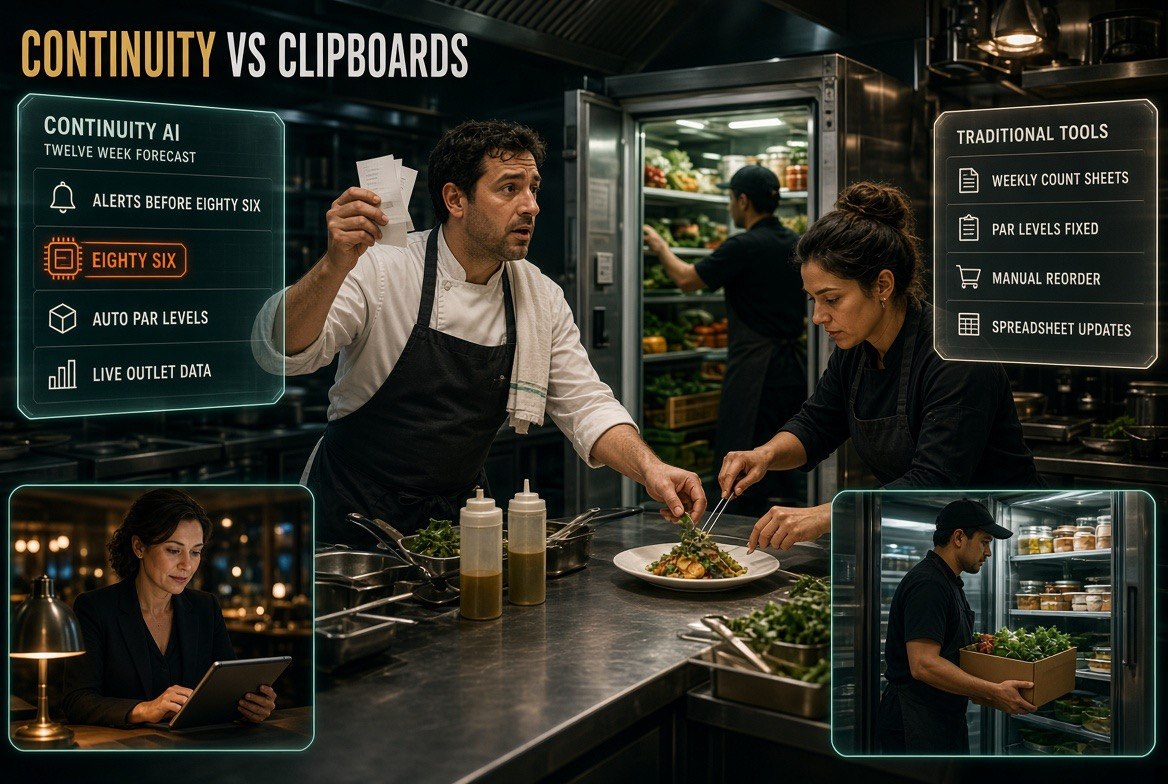
Real kitchens, two different systems. The clipboard tells you what you ran out of last week; a forecasting layer tells you what you are about to run out of on Friday.
Continuity AI vs. Traditional Restaurant Inventory Tools
Independent operators already have inventory tooling. The question worth asking is whether this class of product does something your existing system does not, or whether it is the same reports with a new label. Here is the honest breakdown of where the two approaches diverge.
| Factor | Traditional Inventory & Waste Tools | Continuity AI (Reasoning Layer) |
|---|---|---|
| What it reports | What you have on hand versus par, after counts | What is about to run out, up to 12 weeks ahead |
| Timing of the signal | Reactive — you see it when the count is short | Preventative — flagged against supplier lead times |
| Prioritisation | An alert list you triage by gut feel | 0–100 Impact Score plus Critical/High/Medium/Low |
| Fixability | Unknown until you investigate | Preventable, Partially Preventable, or Unavoidable |
| Recommended action | None — you decide what to do | Next Best Action sized in exact cases, with timing |
| Staff time per issue | Manual investigation across forecast, inventory, supplier data | Automated diagnosis, investigation, and solution |
| Data foundation | Often aggregated across unrelated accounts | Learns from your own operating history |
The distinction is not that one is modern and one is not. It is that traditional tools tell you what happened, and this class of tool tells you what is about to happen and what it will cost you if you ignore it. Both are useful. Only one of them acts before the guest sits down.
What Independent Operators Should Take From This
Most readers of this site do not run 150 locations, and Sightline OS is explicitly built for multi-unit chains — its customers are Bonchon, Din Tai Fung, L&L Hawaiian BBQ, and Goop Kitchen, and its design target is supply chain and inventory planning leaders accountable for a distribution network. If you run one or three restaurants, buying an enterprise supply chain platform is not the move.
But the logic behind Continuity AI is portable, and the three inputs it needs are inputs you already have. Here is how to run a manual version of the same loop, starting this week.
Step 1 — Build the lead-time list. Write down every core ingredient and the realistic number of days between placing the order and receiving it. Most operators know this vaguely and rely on habit. Writing it down converts gut feel into a trigger: if you have fewer days of cover than lead time, you are already in trouble.
Step 2 — Rank your menu by item-level contribution, not by price. Continuity AI scores severity before it acts. You can do the same with a single column: which dishes contribute the most gross profit per cover, and which are the ones guests come specifically for. Those are the items that justify a bigger safety stock and a second approved supplier.
Step 3 — Separate preventable from unavoidable, on paper. Before you spend a shift chasing a substitution, ask whether an order placed today can still land in time. If it cannot, the correct action is menu adaptation and staff communication, not procurement heroics.
Step 4 — Count the 86 board for two weeks. Track every out-of-stock event, the item, the day, and the shift. Two weeks of honest data will show you the pattern — and the pattern is almost always a small number of items at a small number of peak times, not a random distribution.
Step 5 — Fix the top of the list, not the whole list. Most of your lost revenue will sit in a handful of items. Solve those with safety stock, a backup supplier, or a simplified prep that uses what is available.
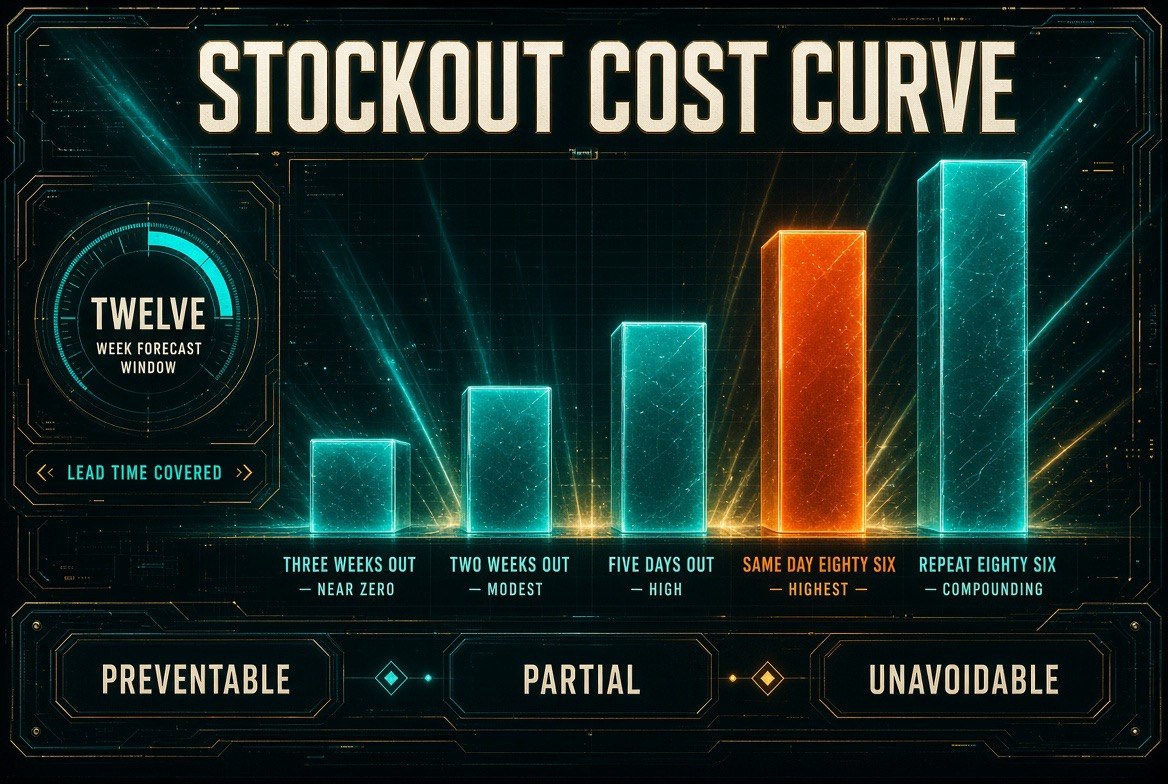
The cost curve is the whole argument. A shortage caught three weeks out costs almost nothing; the same shortage caught on a Friday night costs you the table, the check, and sometimes the regular.
What a Preventable Stockout Actually Costs You
The reason a 12-week lookahead matters is that stockouts have a cost curve, and it climbs faster than most operators assume. The same gap costs you almost nothing if you catch it three weeks out and a great deal if you catch it on the night. Here is how the economics stack up at each stage of the warning window, using a mid-volume independent restaurant as the reference.
| When You Catch It | Options Still Open | Typical Cost Per Event | What It Does To Service |
|---|---|---|---|
| 3+ weeks out | Normal order cycle, alternate supplier, menu adjustment | Near zero — routine ordering cost | Nothing the guest ever notices |
| 1–2 weeks out | Expedited freight, substitute spec, borrow from another store | Modest — expedite fees and higher unit cost | Mostly invisible; some prep changes |
| 2–5 days out | Rush order if a supplier can cover; local cash-and-carry run | High — premium pricing plus labour to source it | Menu shortcuts; staff improvising on the line |
| Same day (86’d) | None — the item is off the menu | Highest — lost covers, comps, and goodwill | Visible to every guest in the room |
| Repeat 86 across weeks | Guest trust already spent | Compounding — regulars stop ordering the item, then stop coming | Brand damage that no single night explains |
Read the table downward and the argument for early detection builds itself. Catching a gap three weeks out costs you nothing because you simply order on the normal cycle. Catching the same gap the day it hits costs you the cover, the comp, and part of the guest’s confidence in your kitchen. The product is identical; only the notice period changed.
That is the operating principle behind Continuity AI’s forward scan, and it is the reason the 12-week horizon is not a marketing number. Lead times of two to six weeks are normal for core restaurant ingredients, so a warning that arrives inside the lead time is not a warning at all — it is an obituary. The engine flags gaps while an order can still be placed and still land. For an independent operator without software, the manual equivalent is the lead-time list from the steps above: the single number that tells you whether today’s gap is still fixable.
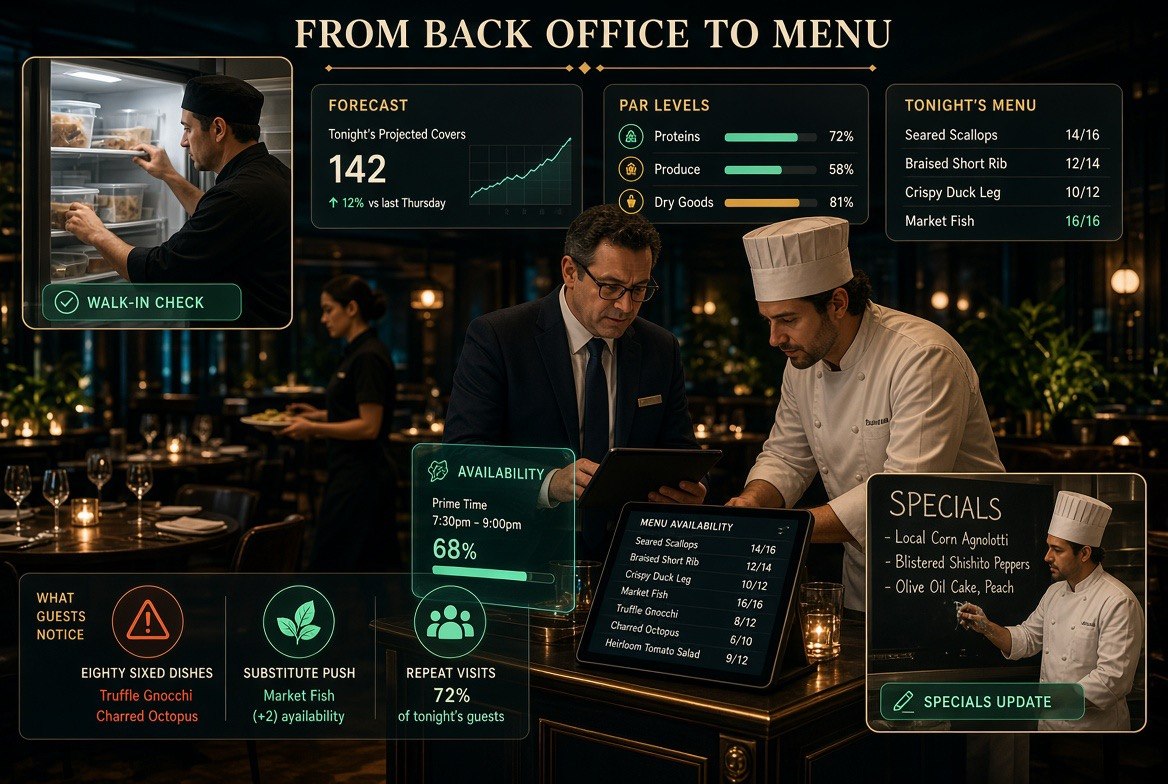
The shift in one picture: forecasting used to stop in the back office, now it lands on the menu board before a guest ever notices a gap.
Why Supply Chain AI Moved From Back Office to Menu
Two things put supply chain software on the menu this year. The first is volatility. As Hu put it in the launch, supply chains are becoming volatile and experiencing disruption at ever-increasing rates, and nothing is a more expensive or urgent supply chain problem for a restaurant than not having what it needs to serve its guests. Best sourcing and top quality mean nothing if a missing ingredient creates menu outages.
The second is that the data finally sits close enough for AI to use. The engine reasons over a chain’s own proprietary supply network data — sales history, order patterns, distributor fill behaviour — and the company argues this makes the workflow genuinely difficult to replicate with generic tools. That is the same shift driving every other category this year: the differentiator stopped being the model and became the data it runs on.
The operational cadence this replaces is worth naming plainly. Today, a supply chain team pulls forecast data from one system, inventory data from another, and supplier information from a third, then manually triages to figure out where action is needed. Continuity AI automates the diagnosis, the investigation, and the recommended solution, so the team jumps straight to decision-making. On a restaurant payroll, that is hours back per week per planner — and it shows up as fewer crisis shifts exactly when the kitchen can least afford them.
There is also a durable lesson in how the launch is scoped. Availability is immediate for existing customers and open to prospective customers evaluating the platform. The company is not selling a moonshot; it is adding a reasoning layer on top of a system operators already run. That is the shape most successful AI adoption takes inside restaurants in 2026 — not a rip-and-replace, but a brain bolted onto the machine that already works.
Frequently Asked Questions
What is Sightline OS Continuity AI?
Continuity AI is a reasoning engine built into the Sightline OS restaurant supply chain platform, launched on September 15, 2026. It activates when an inventory escalation is flagged and delivers an early warning with forward scan, a 0–100 impact score, a mitigation outlook, a next best action sized in cases, and recommended timing.
How far in advance can Continuity AI predict a stockout?
Sightline OS says its platform identifies supply continuity risks up to 12 weeks in advance, then quantifies each one and recommends the specific action to take today to prevent it, including the recovery date to expect.
Who uses Sightline OS today?
Customers include Bonchon, Din Tai Fung, L&L Hawaiian BBQ, and Goop Kitchen. The company is built for supply chain, distribution, planning, and procurement teams at multi-unit owned and franchised restaurant chains, and its team has managed supply chains at brands including sweetgreen, Chipotle, and HelloFresh.
What results has Bonchon reported?
Since implementing Sightline OS, Bonchon’s system-wide weighted average distributor fill rate rose 1.1 percent to reach 99.3 percent, while product substitutions dropped substantially across a network of more than 150 restaurants and 35 distributor operating companies.
Can an independent restaurant use this, or is it chains only?
The platform is designed for multi-unit chains and their distribution networks, so a single-location operator is not the target buyer. The underlying method is still usable: list supplier lead times, rank your menu by contribution, separate preventable from unavoidable stockouts, and log every 86 for two weeks to find where your lost revenue concentrates.

About Barak Schurr
Barak Schurr built and exited a major ticketing platform, ran global operations at Eventbrite, and now focuses on one question: which AI tools actually help independent restaurant owners run leaner and grow faster. He writes from the operator’s perspective — no vendor spin, no theory, just what’s real in 2026.
Email: [email protected]
More Resources for Restaurant Operators