
Get the AI Restaurant Quick-Start Guide — Free
The 5 AI tools independent US restaurant owners are using right now to cut labor costs and answer every call.
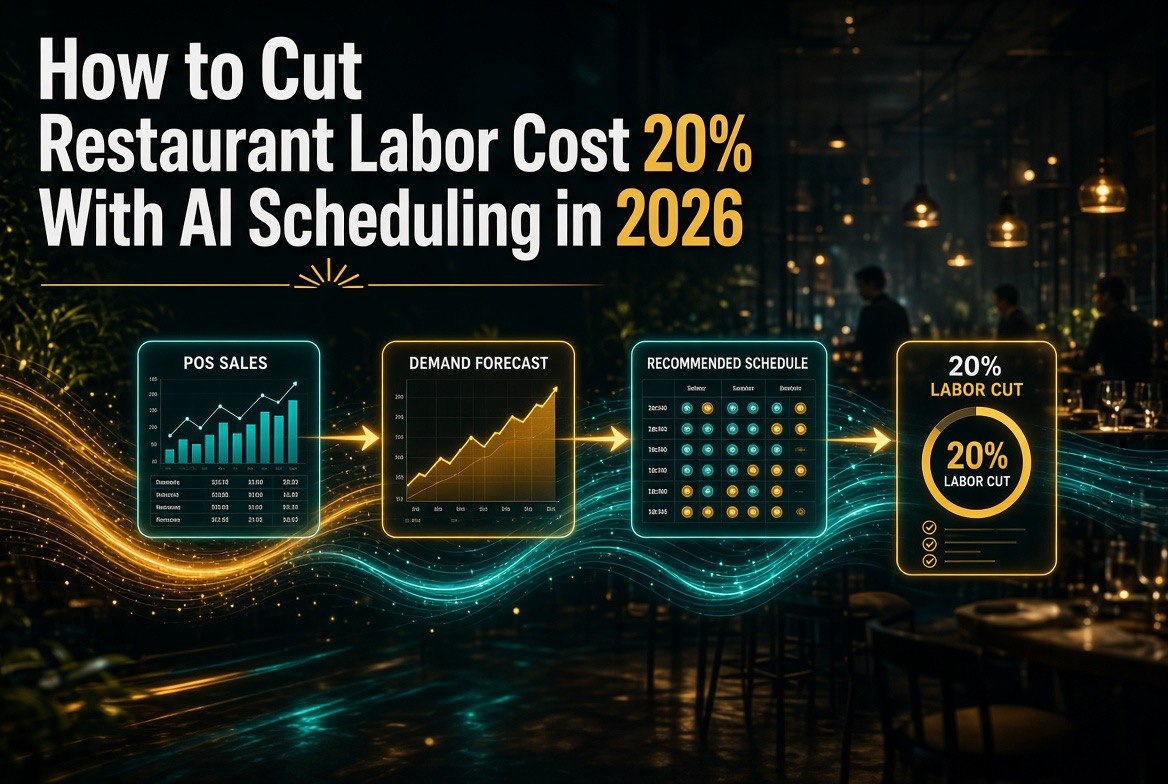
How to Cut Restaurant Labor Cost 20% With AI Scheduling in 2026
⚡ Expert Summary: A 20% labor reduction does not come from firing anyone. It comes from closing the gap between the hours you schedule and the hours your sales actually require — and that gap is almost always bigger than operators think. The National Restaurant Association’s most recent operating data put median fully loaded labor at 36.5% of sales for full-service and 31.7% for limited-service restaurants, and operators who cut their labor percentage typically did it by fixing coverage, not headcount. Teams that instrument that gap against POS data commonly target a 10–20% reduction in non-productive labor within 30–60 days. At $30,000 a week in labor, a 20% cut is $6,000 a week — $312,000 a year.
You already know your labor cost is too high. What you probably do not know is which hours are the problem.
That is the whole reason most labor-cutting attempts fail. An owner looks at payroll, sees a number that is 4 points above where they want it, and does the only thing they can think of: cuts a shift, shortens a closing crew, tells the kitchen to run one less body on Tuesday. Service suffers. Reviews slide. The number comes down a little, then drifts right back up, because nothing about the underlying mismatch was actually fixed.
The mismatch is this: you schedule labor in advance, and demand arrives unpredictably. Every day you publish a schedule, you are making a forecast whether you mean to or not. Most independent restaurants make that forecast from memory and habit — the same Tuesday crew you have run since you opened, the same Friday night double you have always scheduled. AI scheduling does not replace your judgment. It replaces the guessing.
This is the operational playbook for taking 20% out of restaurant labor cost in 2026 using AI scheduling and demand forecasting — with the actual numbers, the tool pricing, and a 30-day pilot you can run without rebuilding your whole operation.
First: Measure the Coverage Gap, Not the Percentage
Stop looking at labor percentage as the primary number. It is a ratio, and ratios lie when the denominator moves.
Here is why that matters. Say month one runs $100,000 in sales against $34,000 in labor — a 34% labor cost. Month two, labor stays flat at $34,000 but sales slip to $90,000. Labor percentage jumps to 37.8%. Nobody got a raise. Nobody was overstaffed. Your labor percentage went up because sales went down. If you respond to that by cutting shifts, you have treated a sales problem as a staffing problem, and you will make the damage worse.
The number that actually tells you where money is leaking is the coverage gap: scheduled hours minus needed hours, measured slot by slot across the day.
Needed hours are not a mystery. You can derive them from data you already have:
For front of house: covers per server, or better, sales per labor hour. If your target is $75 in sales per labor hour and a given Tuesday lunch does $300 in sales, you need roughly 4 labor hours on the floor — not the 12 hours that are currently scheduled across a full opening crew.
For back of house: ticket volume per time block. If the kitchen produces 25 tickets in a 2-hour window and a cook handles 15 tickets an hour, you need about 1.7 cook-hours, not 4.
Do that math for every daypart for four straight weeks and tag each gap as either overstaffing (pure waste — paying people to stand) or understaffing (service loss — comps, long ticket times, bad reviews). Almost every independent restaurant running above 34% finds the same pattern: heavy overstaffing in predictable slow dayparts that nobody ever questioned, plus a handful of understaffed peak windows where the manager panics and pays overtime to cover.
You cannot cut 20% you have not located. This step is the entire foundation.
Where the Money Actually Is
Once you measure the gap, the savings break into four buckets. Here is what each one is worth at a restaurant running $30,000 a week in labor.
| Leak | Typical Size | Weekly Recovery at $30K Labor | How AI Closes It |
|---|---|---|---|
| Overstaffing slow dayparts | 4–8% of labor | $1,200–$2,400 | Demand forecast per 15–30 min slot |
| Unplanned overtime | 3–6% of labor | $900–$1,800 | Mid-week OT alerts before threshold |
| Manager time on scheduling | 5–10 hrs/week | $150–$400 | Auto-generated recommended coverage |
| Break/meal violations & drift | 1–3% of labor | $300–$900 | Clock + compliance guardrails |
| Total addressable | 13–27% of labor | $2,550–$5,500 | The 20% target sits inside this |
Read that total row carefully. The addressable range is 13–27% of labor — which means 20% is not an aggressive target, it is mid-range. That is the honest version of the claim, and it is why operators who instrument the gap and deploy forecasting commonly land in the 10–20% reduction range for non-productive labor within 30–60 days. You are not downsizing your team. You are removing hours that were never producing anything.
Notice too where the money mostly is not. Cutting one server from every shift is crude, visible, and damages service. Removing overstaffing from four specific slow dayparts is invisible to guests and worth more.
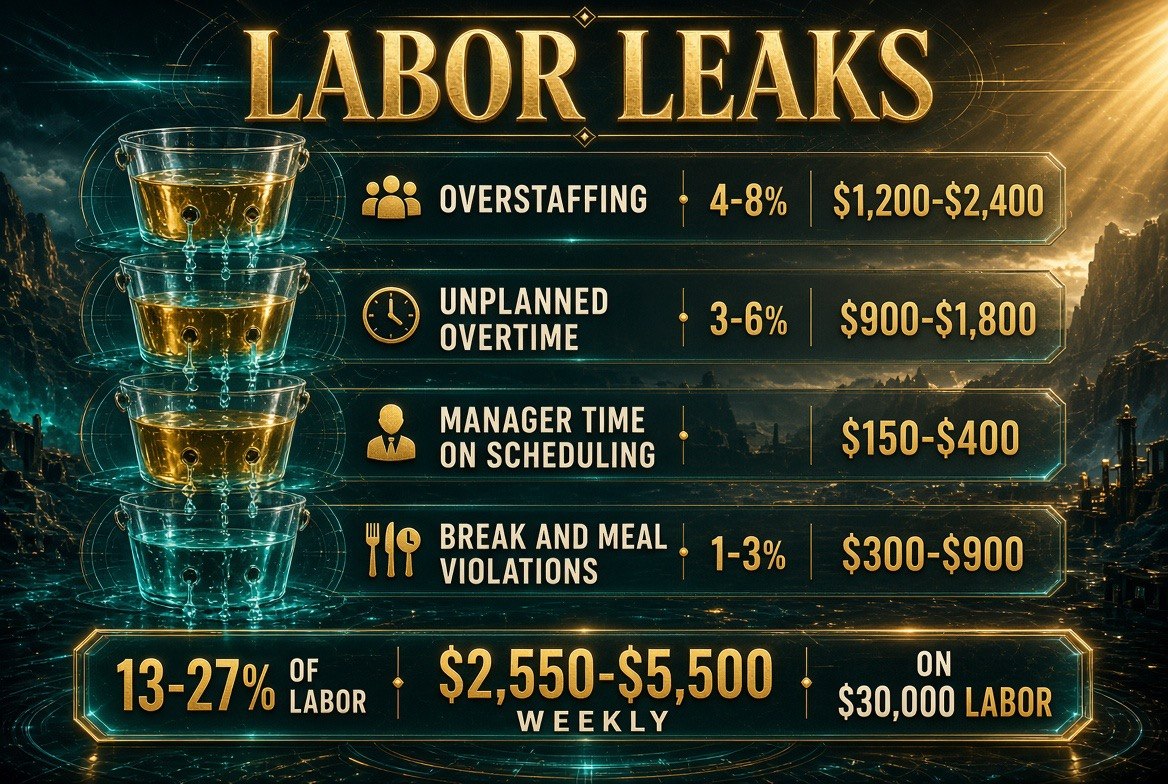
Four leaks, one weekly recovery figure: overstaffing slow dayparts is the biggest single bucket at $1,200–$2,400, but the four together put 13–27% of labor back on the table — $2,550–$5,500 a week at $30,000 labor.
Tool Pricing: What AI Scheduling Actually Costs
The reason this is a 2026 conversation and not a 2019 one is that restaurant-specific scheduling platforms now ship forecasting and guardrails as standard features rather than enterprise add-ons. Here is the current landscape.
| Layer | 7shifts | Homebase / Generic Tools | Best Fit |
|---|---|---|---|
| Entry price | $39.99/location/mo (Essentials) | $0 Basic tier available | Single unit testing the waters |
| Full tier | $79.99/location/mo (Pro) | Per-location rungs, broader hourly focus | Restaurant-specific depth |
| Forecasting overlay | Built into labor suite | Add-on layer, from ~€99/mo | Chronic over/under coverage |
| Payroll | Integrated | Toast: monthly min vs PEPM | Watch active-employee counts |
| Payback test | One avoided OT scramble shift | One avoided manager hour/week | Both cover the fee |
Here is the sanity check that should decide this for you. A $79.99/month Pro subscription at one location costs you $960 a year. One avoided overtime-heavy scramble shift — the Friday where two people call off and you pay three staff time-and-a-half to cover — routinely costs more than that single shift. The subscription pays for itself the first time it prevents one bad night.
If you bundle payroll, read the billing structure before you sign. Toast Payroll, for example, bills a monthly SaaS fee once per month, and the charge is the higher of a monthly minimum, a per-employee-per-month (PEPM) fee, or a base fee plus PEPM — calculated from active employees on the first check date of the month. That last detail matters more than it sounds: if your termination process is sloppy, you can be paying PEPM on people who no longer work for you.
Step 1: Export 4 Weeks of POS Data and Your Published Schedules
This is the only step that requires real work, and it takes about two hours.
Pull hourly (or 15-minute) sales for the last four weeks from your POS — Toast, Square, or whatever runs your register. Then pull your published schedules for the same period. If those two files have never existed side by side, you have just found your problem.
Map them. For each daypart, calculate:
Needed hours = sales for that slot ÷ your target sales-per-labor-hour.
If your target is $75 per labor hour and that slot did $450, you need 6 hours. If you scheduled 10, your coverage gap is 4 hours — roughly $100–$150 of pure waste in one slot, on one day. Multiply that across four weeks of slow lunches and it is your entire savings target.
Keep it simple at first. Do not try to model every fifteen minutes across every role. Start with 3–5 core dayparts — weekday lunch, weekday dinner, weekend brunch, weekend dinner, late night — and get those right. Refinement comes later.
Step 2: Turn On Guardrails Before You Turn On Forecasting
Counterintuitive but important: the fastest, most reliable savings do not come from AI prediction. They come from alerts that catch leakage you are already suffering.
Turn on three things in whatever scheduling platform you choose:
Overtime alerts. Set a threshold — say 36 hours projected for anyone on a 40-hour week — and have the system notify the manager mid-week, while there is still time to move a shift. Most overtime in independent restaurants is not a workload problem; it is a scheduling problem that was discovered too late to fix. By the time payroll runs, your only options are pay it or commit wage theft.
Break and meal-period reminders. Compliance violations are small, individually boring, and systematic. An employee who misses a meal period every shift is a predictable weekly cost plus a legal exposure. Guardrails eliminate the drift.
Shift swap and approval flows. This one protects the plan rather than cutting cost directly. When a swap goes through a documented approval flow, the manager can see whether the replacement puts someone over their weekly hours. When swaps happen by text message, nobody sees anything.
Operators who instrument these guardrails typically find 3–6% of labor sitting in unplanned overtime alone. That is already a quarter of your 20% target, and you have not touched forecasting yet.
Step 3: Add Demand Forecasting to Generate Recommended Coverage
Now the actual AI layer — and it is less mysterious than the vendor decks suggest.
A forecasting system ingests your POS transactions, and often reservations, online orders, weather, calendar holidays, and local events. It produces a demand forecast by daypart. It converts that forecast into recommended labor hours by role or station, applies your constraints (availability, skill levels, minors, break rules), and outputs a schedule recommendation.
The weather and events inputs are not gimmicks. They are exactly the variables that make a Tuesday unpredictable. A patio-heavy restaurant in a market where a 20-degree temperature swing flips outdoor seating on and off has a genuine forecasting problem that no amount of manager instinct solves. A restaurant near a stadium, a convention center, or a university campus has demand spikes that a habit-based schedule will always miss.
Publish from the recommendation, but keep a manager override log. This is the single most underrated practice in the entire system. Every time your manager overrides the forecast, write down why. After four weeks you have either evidence the model is missing a real signal — in which case you adjust the weighting — or evidence that your manager is scheduling from habit — in which case you have found the exact behavior that was costing you money.
The most common failure mode here is worth naming plainly: forecasts that never reach the floor. If the recommended coverage never actually makes it into the published schedule, you bought analytics, not operations. Assign one manager as the forecast owner per location and make that person accountable for whether recommendations get used.
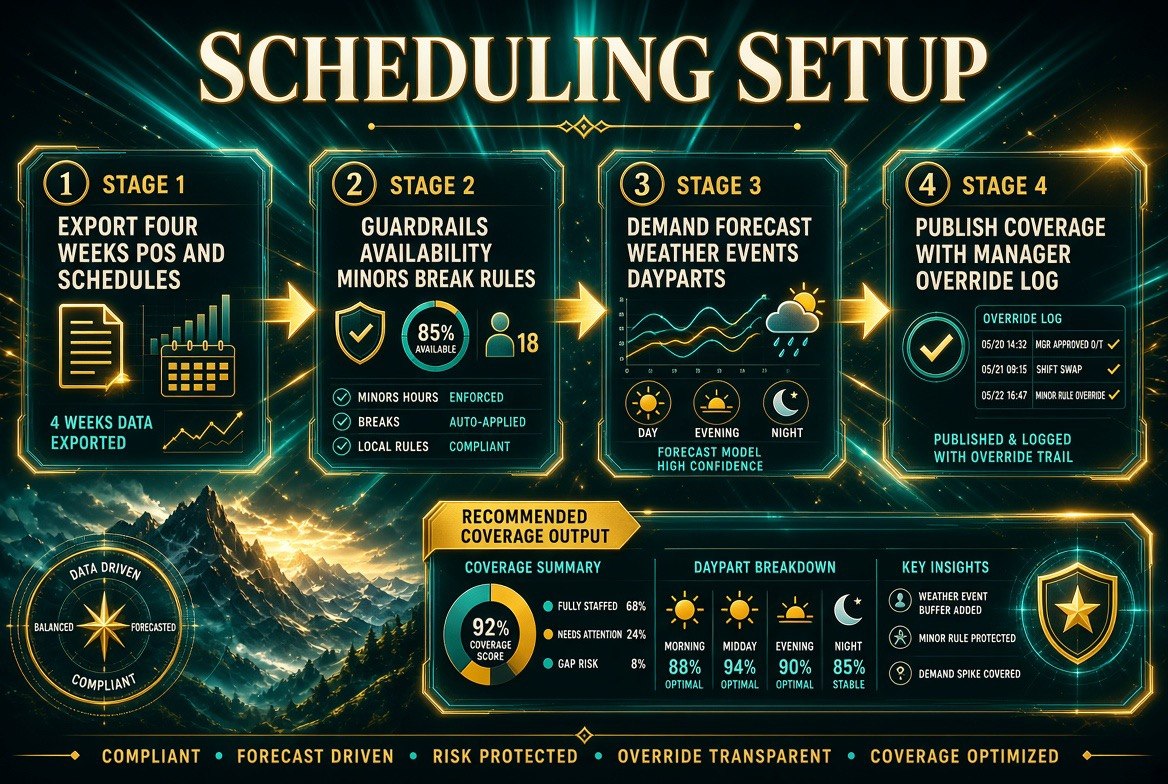
The sequence matters more than the software: data first, guardrails second, forecasting third, then publish from the recommendation with an override log. Forecasting on top of broken constraints just automates the wrong schedule.
Step 4: Cross-Train So Lean Shifts Do Not Break
Forecasting tells you a shift needs fewer people. Cross-training is what makes fewer people actually workable.
A server who can run food. A cook who can work both the line and prep. A host who can handle takeout and delivery handoffs. Staff who cover more than one station let you run leaner shifts without creating gaps in the middle of a rush — and they are the difference between a schedule that looks efficient on paper and one that survives a Friday night.
Cross-training is also your answer to the legitimate fear that AI scheduling means understaffing. It is the opposite: you are building the flexibility to move one person between stations instead of calling in a second body.
Step 5: Run the 30-Day Pilot With a Scorecard
Do not roll this across all locations or all dayparts at once. Pick one unit, or one chronically volatile daypart, and run a hard 30-day test.
Week 0 — Baseline. Export the four weeks of POS and schedule data. Tag every gap as overstaffing or understaffing. This is your “before” number and you cannot fake it later.
Week 1 — Guardrails. Overtime alerts, break reminders, swap approvals. Expect immediate early wins here; this week usually produces the most visible quick payback.
Weeks 2–3 — Forecasting. Turn on forecast drivers, compare forecast against actual by daypart, publish schedules from recommendations, log every manager override.
Week 4 — Quantify. Track four numbers: overtime hours, manager hours spent on scheduling, labor cost variance against budget, and service KPIs (ticket times, wait times, comps, review scores).
The decision rule is simple and it protects you from a bad purchase: if you can sustain even a modest reduction in non-productive labor, the subscription is self-funding. If the coverage gap has not shrunk after 30 days, the tool is not the problem — either the recommendations are not reaching the schedule, or your data mapping is wrong. Fix those before spending more.
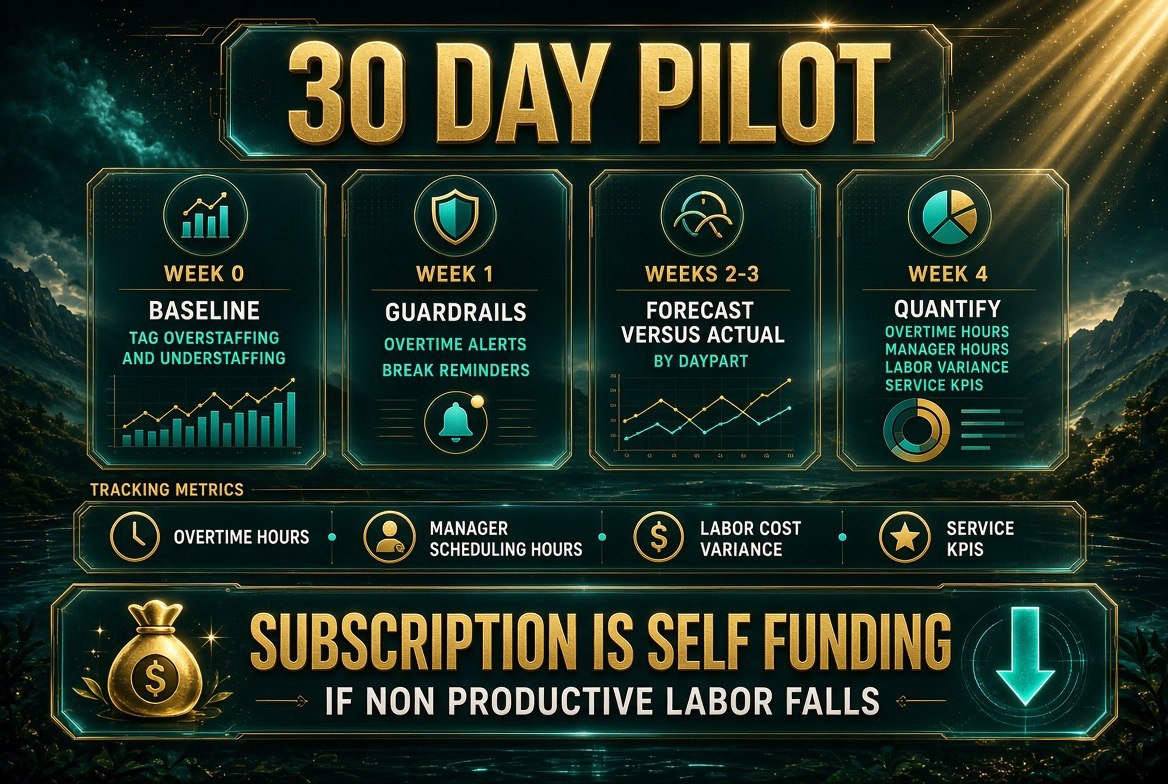
Track four numbers, not twelve: overtime hours, manager scheduling hours, labor cost variance against budget, and service KPIs. If non-productive labor falls and holds, the subscription is self-funding.
The Mistakes That Kill the 20% Target
Cutting headcount instead of hours. Firing a server reduces labor and reduces sales. Trimming two hours off a slow Tuesday lunch reduces labor and reduces nothing else. The second one is repeatable every week, forever.
Treating a rising labor percentage as a staffing problem. Check whether sales moved first. A four-point jump in labor percentage with flat labor dollars is a sales conversation, not a schedule conversation.
Cutting to the “30% rule.” The 30% benchmark is popular because it is simple, and it is frequently wrong for a specific concept. Full-service median labor runs 36.5% of sales; limited-service runs 31.7%. A fine-dining room with tableside service will always run higher than a counter-service café, and that is the business model working, not a failure. Compare yourself to restaurants with your service model, not to a number someone posted online.
Chasing the percentage instead of sales per labor hour. The better question is rarely “how do I staff fewer people” — it is “how do I generate more revenue from the hours I already pay for.” Sometimes the higher-leverage move is a menu change, a prep routine, or a delivery-channel fix, not a schedule change.
Ignoring the floor’s feedback. Your team knows which shifts are overstaffed. They have known for months. The guardrail-and-forecast system works best when managers are openly using it to fix coverage rather than to shave hours, because the difference between those two things is visible to everyone working the shift.
The 20% Math, Honestly Stated
Here is what the target actually requires, in plain numbers.
At $30,000 a week in labor — a realistic figure for a busy independent full-service restaurant — 20% is $6,000 a week, or about $312,000 a year. That is the headline number, and it is real, but it assumes you attack all four leak categories simultaneously and sustain it.
A more conservative and more achievable sequence looks like this: 4–6% from overstaffing slow dayparts in the first 60 days, 3–4% from overtime guardrails in the first 30, 2–3% from eliminating manager scheduling hours immediately, and 1–2% from compliance drift. That is 10–15% inside two months, with the remaining 5–10% coming as forecasting accuracy improves over two quarters.
That is why the honest framing of “20% with AI scheduling” is not that the software does something magical. It is that the software gives you the visibility to do the four things you already knew you should do, plus the accountability to keep doing them every week instead of only in the month after a bad P&L.
Start with the measurement. You cannot cut 20% of a number you have never actually calculated.
Frequently Asked Questions
Can AI scheduling really cut restaurant labor cost by 20%?
Yes, but the 20% comes from four sources combined, not one feature. Overstaffing in slow dayparts is typically worth 4–8% of labor, unplanned overtime 3–6%, manager scheduling time 5–10 hours a week, and compliance drift 1–3%. That combined addressable range of 13–27% of labor is where the 20% target sits. Operators who instrument the coverage gap and use forecasting commonly target 10–20% reductions in non-productive labor within 30–60 days.
What is the coverage gap and why does it matter more than labor percentage?
The coverage gap is scheduled hours minus needed hours, measured slot by slot across the day. It matters more than labor percentage because labor percentage is a ratio that moves when sales move — a four-point jump can happen with zero staffing changes if revenue drops. The coverage gap isolates hours that genuinely produce nothing, which is the only labor you can cut without damaging service.
How much does restaurant AI scheduling software cost in 2026?
7shifts lists Essentials at $39.99 per location per month and Pro at $79.99 per location per month on its US pricing page. Homebase offers a $0 Basic tier with paid rungs above it. Dedicated forecasting overlays start around €99 per month per restaurant. A $79.99 Pro subscription costs $960 a year and is usually covered by avoiding a single overtime-heavy scramble shift.
What should a restaurant’s labor cost percentage actually be?
The National Restaurant Association’s most recent operating report, based on more than 900 operators, found median fully loaded labor costs of 36.5% of sales for full-service restaurants and 31.7% for limited-service. Profitable full-service operators ran around 34.2% while loss-making ones ran near 42.9%. Treat these as comparison points against restaurants with your service model, not as universal targets.
Do I need to fire staff to hit a 20% labor reduction?
No, and firing is usually the wrong first move. Cutting a server reduces labor and also reduces sales. Trimming overstaffed hours from slow dayparts reduces labor while leaving revenue untouched, and it is repeatable every single week. Cross-training your existing team is what makes leaner shifts workable without creating service gaps.
How long before AI scheduling shows results?
Overtime guardrails typically produce visible savings within the first two weeks. Coverage improvements from forecasting usually show meaningful results in 30–60 days, once the model has enough of your own POS history to forecast accurately. A 30-day pilot with a defined scorecard is enough to decide whether to scale to additional locations.

About Barak Schurr
Barak Schurr built and exited a major ticketing platform, ran global operations at Eventbrite, and now focuses on one question: which AI tools actually help independent restaurant owners run leaner and grow faster. He writes from the operator’s perspective — no vendor spin, no theory, just what’s real in 2026.
Email: [email protected]
More Restaurant AI Resources